> For the complete documentation index, see [llms.txt](https://help.smartico.ai/welcome/llms.txt). Markdown versions of documentation pages are available by appending `.md` to page URLs; this page is available as [Markdown](https://help.smartico.ai/welcome/products/bi-and-reporting/missions-dashboard.md).
# Missions Dashboard
## 📘 Overview
The Missions & Badges Dashboard provides statistical, operational and analytical overview for your Missions and Badges related KPIs. This report is divided into six tabs:
* Summary
* Alerts
* General Stats
* Operational Data
* Analytical Data
It’s designed to help you in monitoring, managing and optimizing your business usage of the Missions Gamification feature, and make data-driven decisions.
**🔍 How to Access the Missions Dashboard**
1. Navigate to Reports → Gamification → "Missions & Badges"
2. Available Filters:
1. Period
2. Product Type (Mission / Badge)
3. Mission / Badge ID
4. Mission / Badge Name
5. Short Mission
6. Users' Gamification Level
7. Brand
8. User ID (Internal ID)
9. Ext User ID (Operator Player ID)
**The Report consists of 6 tabs:**
1. **Summary -** presents the management summary of the product.
2. **Alerts -** focuses on the points that might require an immediate attention.
3. **General Stats** - focuses on the overall stats and trends of the Missions and Badges related KPIs.
4. **Operational Data** - provides the operational insights on the optimizations of the Missions and Badges product in your Business.
5. **Analytical Data** - measures the behavioral and financial effectiveness of Missions usage.
6. **Tasks KPIs** - provides granular task-level start and completion performance for missions and badges.
## Summary tab:
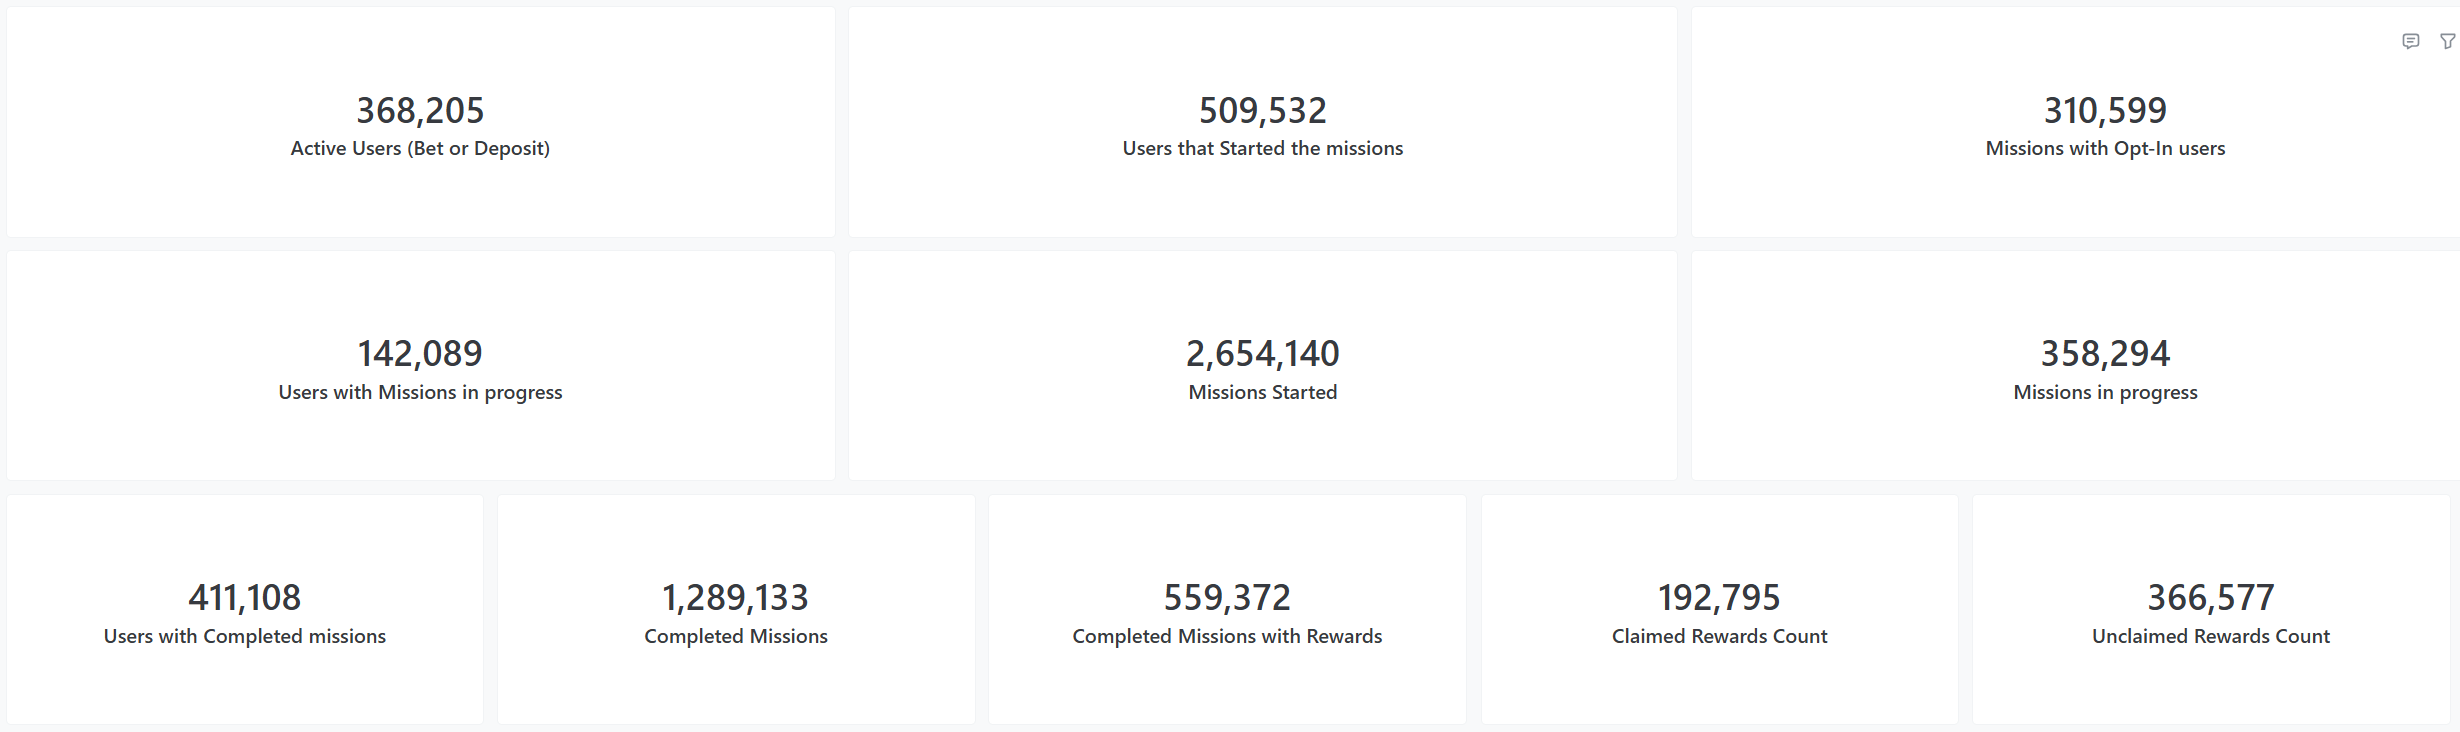
A set of KPIs showing the total Missions performance during the chosen period.
**Key Funnel Steps Included:**
* Active Users (Bets or Deposits) - users that had a Bet or a Deposit (unrelated to the missions) during the filtered period.
* Users that started the missions - count of unique users that started the missions during the filtered period.
* Missions with Opt-In users - count of Missions with an explicit opt-in that was made by the user.
* Users with Missions in progress - count of unique users that are engaged in any mission during the filtered period.
* Missions Started - number of missions that started during the filtered period.
* Missions in progress - number of missions that started during the filtered period, but have not been completed yet.
* Users with Completed missions - number of unique users that started the missions during the filtered period and completed them.
* Completed Missions - number of missions that started during the filtered period and were completed.
* Completed Missions with Rewards - number of missions with a reward upon completion, that started during the filtered period and were completed.
* Claimed Rewards Count - number of cases with the rewards, claimed for the mission completion.
* Unclaimed Rewards Count - number of cases where reward was available upon completion of the mission, but it wasn't claimed.
{% hint style="info" %}
**Value to You:**
* Conversion Efficiency: Measure the "hook rate" by comparing general Active Users to those who actually Start Missions.
* Engagement Quality: Distinguish between passive participation and high-intent commitment through Opt-In and In-Progress tracking.
* Friction Analysis: Identify "drop-off" points where missions are started but not Completed, highlighting if tasks are too difficult.
* Reward Optimization: Analyze Claimed vs. Unclaimed Rewards to determine if incentives are attractive enough to drive final action.
{% endhint %}
## Alerts tab:
### Section 1: Longest Running currently Active Missions
This section shows the list of longest running missions, allowing you to monitor the activity and pause the "forgotten" ones.
**Key Metrics Included:**
* Mission details - Mission ID, Mission Name, Mission Status, Mission Type
* Days of Mission being Active - number of days between the beginning of the Mission and today, while it's still Active.
* User in progress count - count of unique users that are still active within the mission.
{% hint style="info" %}
Value to You:
* Identify Stagnation: Spotlights "forgotten" missions that have been active for an extended period but fail to move users to completion.
* Cost & UX Control: Enables quick identification of missions to pause, reducing UI clutter and potential bonus liability from stale campaigns.
* Difficulty Audit: High "Days Active" combined with a high "In-Progress" count signals that mission requirements may be too difficult to achieve.
{% endhint %}
### Section 2: Top 50 users with highest number of active Missions
This section introduces the list of Users that are active on most of the Missions, splitting the missions by their Type.
**Key Metrics Included:**
* User details - User ID, User RFM Segment, User Value Score
* Number of Active Missions - count of Missions, the user is currently active on, split by the Mission Type.
{% hint style="info" %}
**Value to You:**
* Identify Power Users: Spotlights the most engaged enthusiasts who simultaneously manage multiple tasks across various mission types.
* Monitor Bonus Exposure: Detects users "stacking" numerous missions, helping to mitigate the risk of excessive bonus liability or exploitation.
{% endhint %}
### Section 3: Missions with Unclaimed Rewards
This section lists the Reward-offering Missions with the split into claimed and non-claimed rewards.
**Key Metrics Included:**
* Mission details - Mission ID, Mission Name, Mission Status, Mission Type
* Completed Missions Count - number of missions that were completed by the users.
* Claimed Rewards Count - number of reward-offering missions, for which the rewards were claimed.
* Unclaimed Rewards Count - number of reward-offering missions, for which the rewards were not claimed.
{% hint style="info" %}
**Value to You:**
* Evaluate Incentive Relevance: Identify if offered rewards are truly motivating by measuring the gap between mission completion and actual reward claims.
* Optimize User Experience: Detect technical friction or poor visibility in the "claim" process if Unclaimed Rewards Count is disproportionately high.
* Audit Mission ROI: Compare Completed Missions Count against Claimed Rewards to determine which mission types successfully drive the final desired action.
{% endhint %}
### Section 4: Missions with low Completion Rate
This section lists Missions with high number of participants as well as the completion rates per mission. Filtered to the Missions with Completion Rate below 80%.
**Key Metrics Included:**
* Mission details - Mission ID, Mission Name, Mission Type
* Mission Started Count - number of times, the mission has been started.
* Mission Completed Count - number of missions that were completed by the users.
* Completion Rate - share of Mission Completed Count out of Mission Started Count.
* Mission in Progress Count - number of Missions that started but not completed.
{% hint style="info" %}
**Value to You:**
* Identify Completion Barriers: Spotlights specific missions where players drop off, signalling that the requirements may be too difficult or the tasks unappealing.
* Improve Marketing ROI: Ensures that the effort spent on Mission Started Count actually results in the desired outcome of a Completed Mission.
{% endhint %}
## General Stats tab:
### Section 1: Total Actives VS Missions Participants
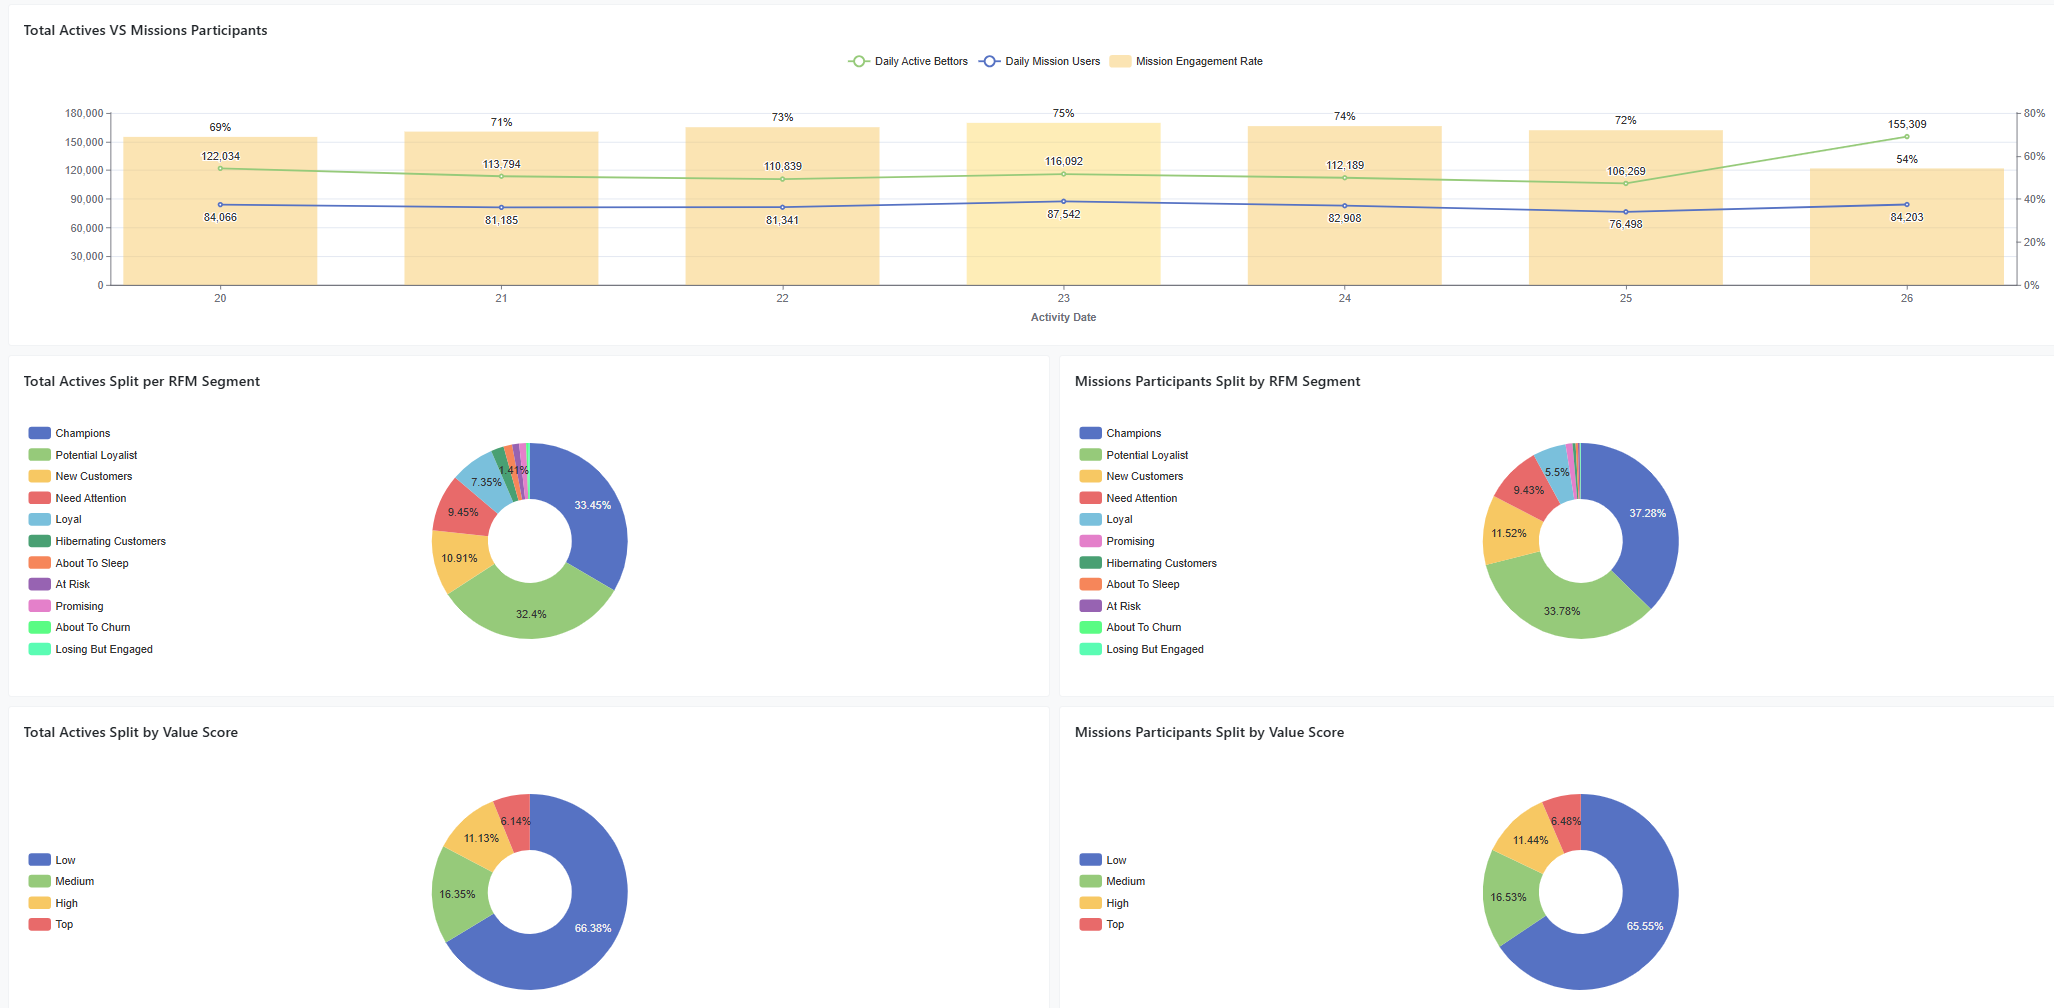
This section introduces the users' daily involvement in Missions, as well as the comparison between the Mission Active Users to the General Active population by the RFM Segments and Value Score Segments distribution .
**Key Visualization:**
The chart shows the daily trend of the total Active Users (with either bets or deposits), the Daily Trends of users that had Mission related activity, and the share of the Mission Actives out of Total Actives.
Below this chart you can find the split of the two populations by RFM Segmentation and Value Score Segmentation, allowing you to compare the representations of the different Segments in the Missions participation.
{% hint style="info" %}
**Value to You:**
* Benchmark Gamification Reach: Measure the daily "hook rate" by comparing Mission Actives against the Total Active population to quantify how much of your daily traffic interacts with missions.
* Identify Segment Preferences: Compare RFM Segmentation and Value Score distribution to determine if high-value players (e.g., Champions) are under-represented in mission activity.
* Monitor Engagement Trends: Track daily participation fluctuations to evaluate the impact of new mission launches on overall player activity.
* Optimize Segment Targeting: Analyze the representation of different segments (e.g., Potential Loyalists vs. At Risk) to tailor mission difficulty or rewards specifically for the groups that participate most.
{% endhint %}
### Section 2: Additional Missions Stats
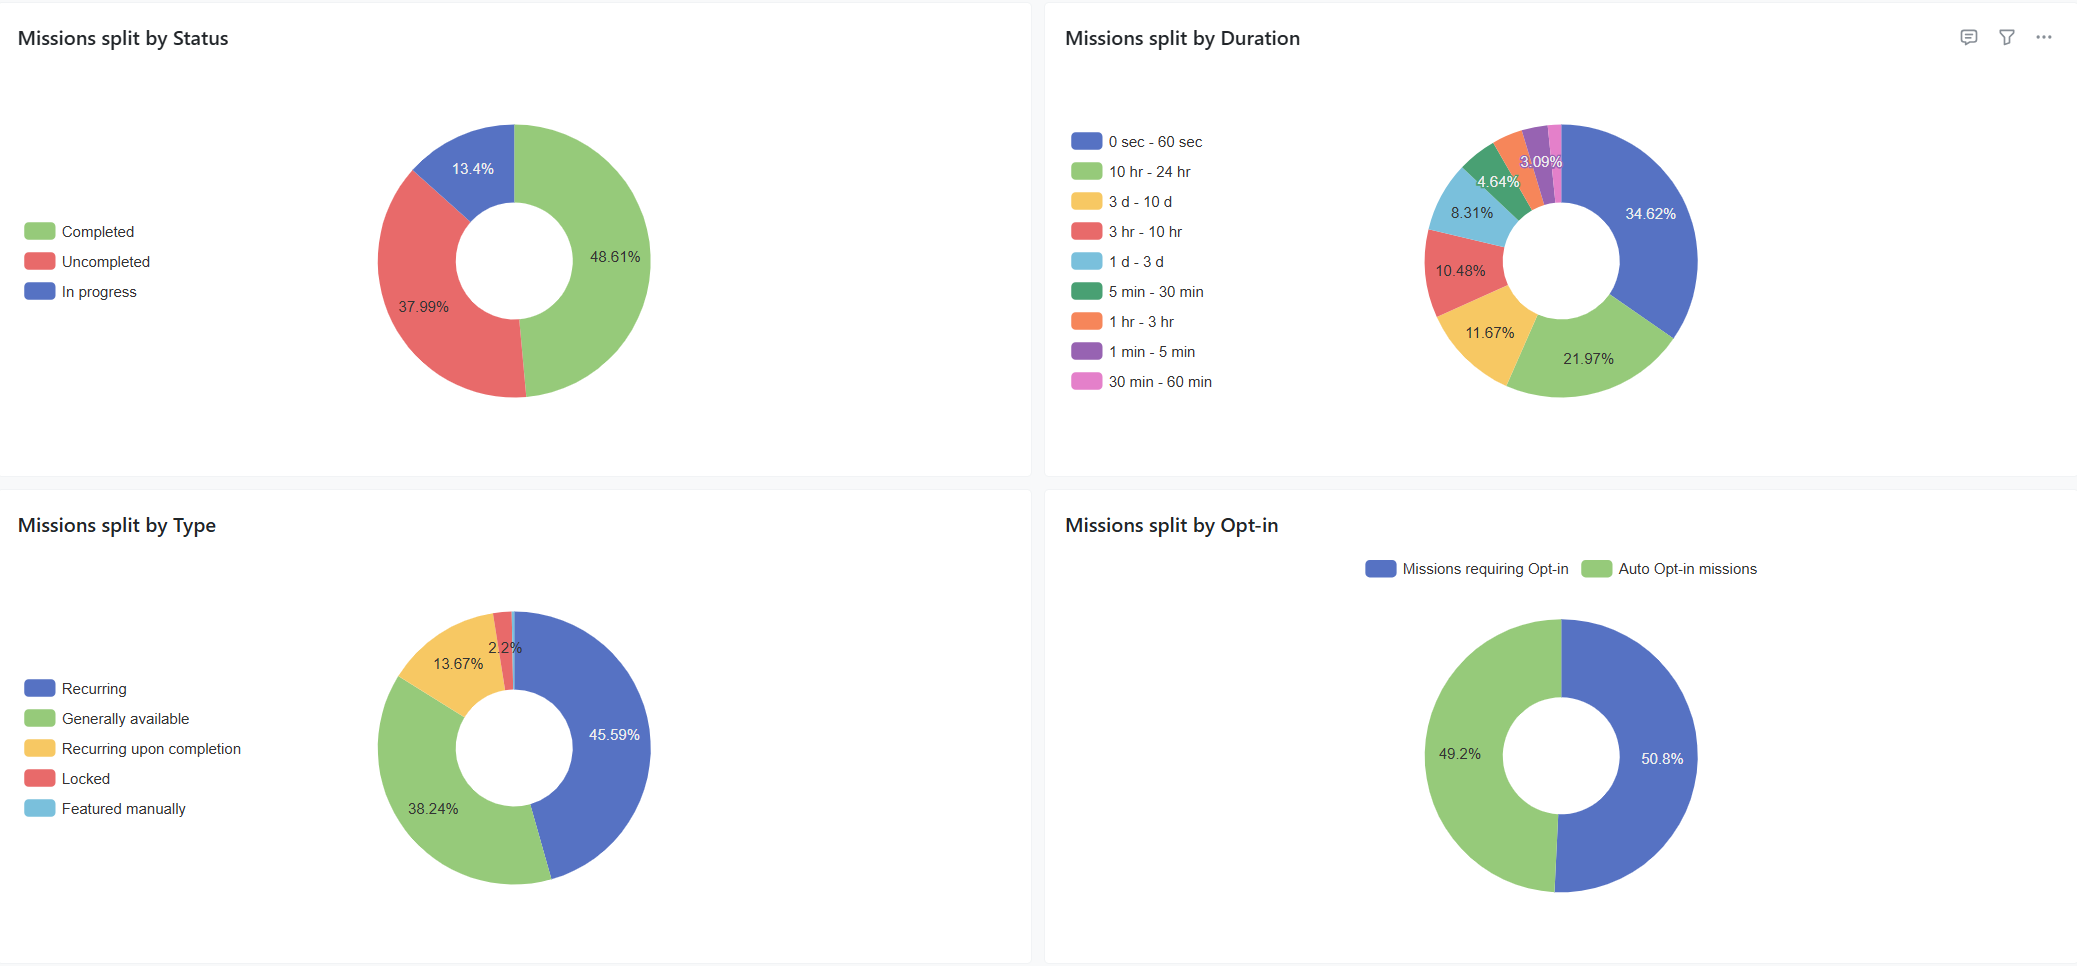
This section introduces distribution of the Missions by different Mission characteristics.
**Key Characteristics:**
* Missions split by Mission Status
* Missions split by Duration of the mission
* Missions split by Mission Type
* Mission split by Opt-in Types
{% hint style="info" %}
**Value to You:**
* Analyze Mission Health: Monitor the distribution of Mission Status to ensure the portfolio has an optimal balance of active, paused, and scheduled content.
* Optimize Campaign Length: Evaluate the Duration of the mission to determine if players prefer short-term "burst" challenges or long-term engagement goals.
* Evaluate Engagement Periodicity: Tracks Mission Type (e.g., Recurring vs. Generally Available) to balance consistent daily habits with one-off promotional events.
* Measure Participation Friction: Assess Opt-in Types to understand how different entry requirements (e.g., automatic vs. manual) impact overall user involvement.
{% endhint %}
### Section 3: Daily Missions Completion Rate
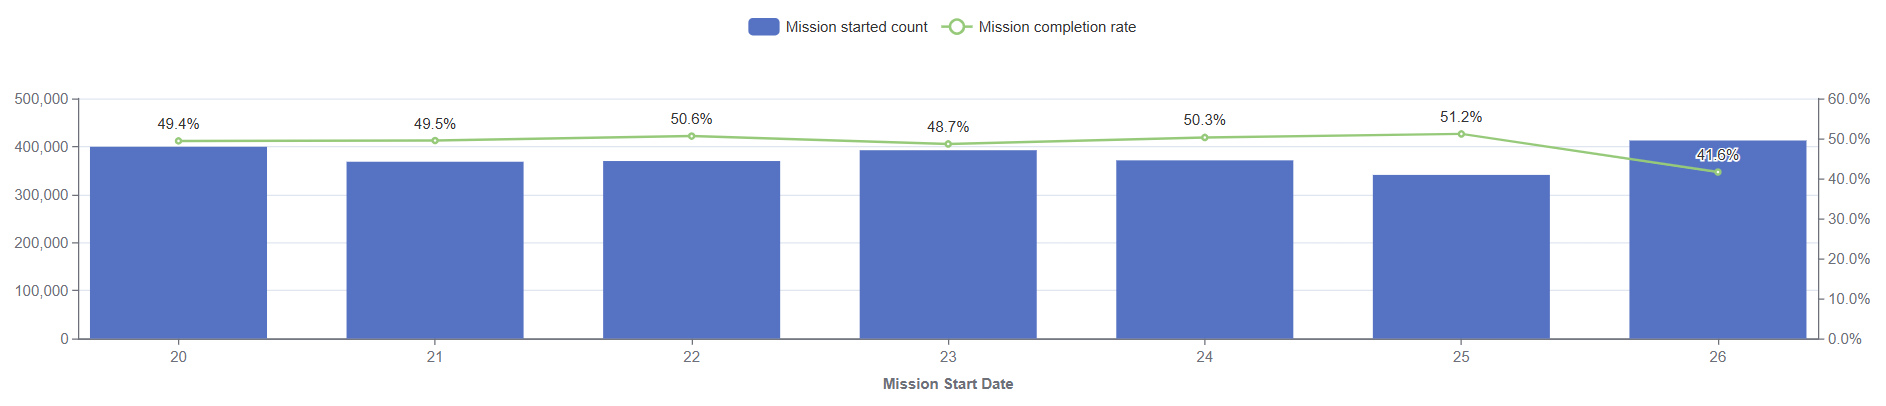
This chart shows the number of missions over time based on their **start date**.
**Key Concept:**
The KPIs - Missions Started and the Completion Rate
If the mission is started on Jan 1, and completed on Jan 5, the completion will be counted on the day of start (Jan 1)
{% hint style="info" %}
**Value to You:**
Monitor Conversion Trends: Identify specific days or periods where mission starts failed to lead to completions, highlighting potential technical issues or unappealing mission structures on those dates.
{% endhint %}
## Operational Data tab
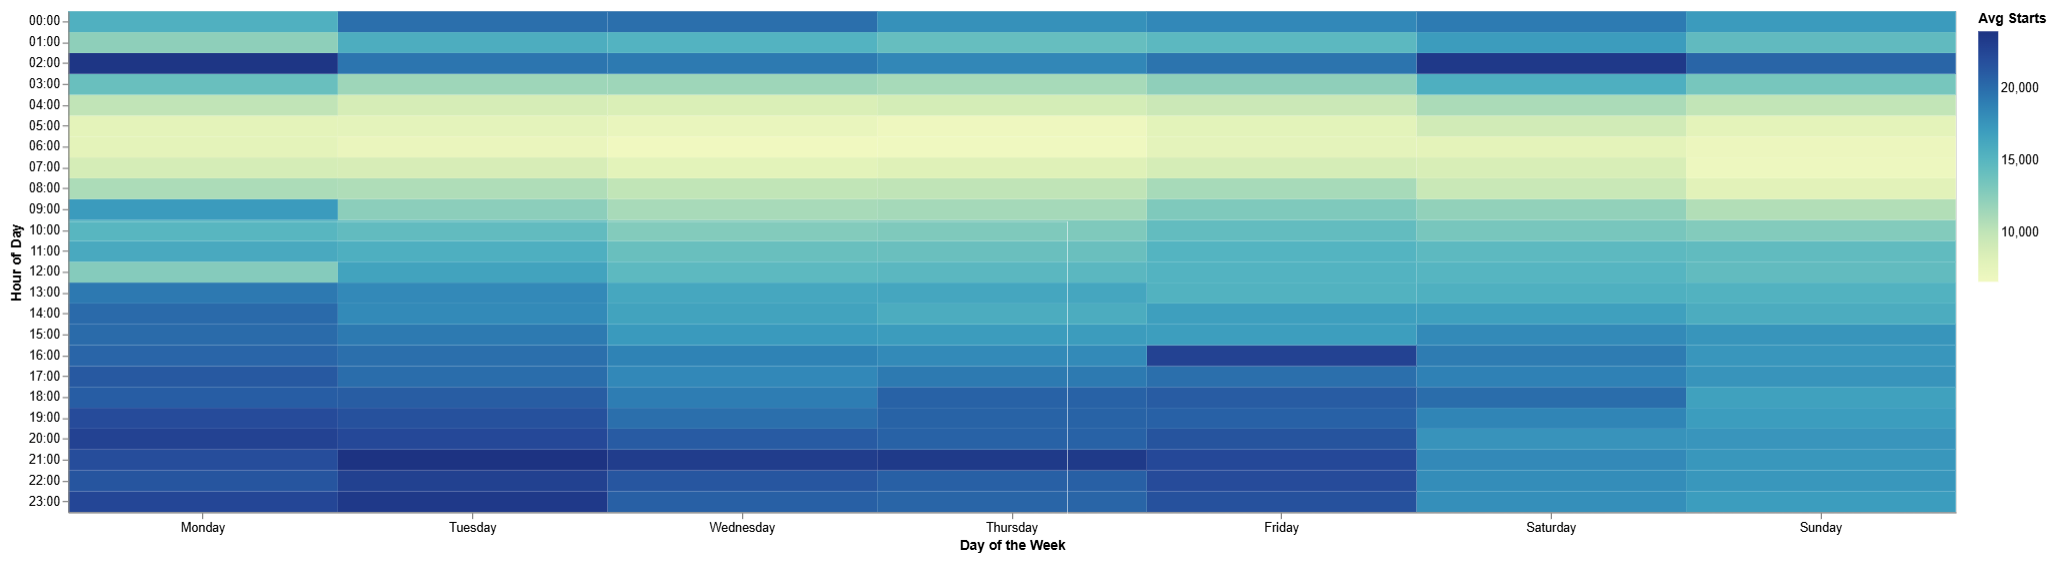
### Section 1: Missions Heatmap
The chart shows the average number of Missions participants' activity by weekday and hour, allowing you to spot the preferred times of the Mission usage.
**Key Visualization:**
* Average Number of Mission participants during the filtered period per weekday and hour.
{% hint style="info" %}
**Value to You:**
* Identify Peak Engagement Windows: Pinpoint the exact days and hours when players are most active in missions, allowing for the precise scheduling of limited-time or "flash" missions.
* Maximize Promotional Impact: Ensure that mission-related announcements or push notifications are sent during high-traffic periods to capture maximum user attention.
{% endhint %}
### Section 2: Top 10 shortest and Top 10 longest missions.
The tables show the list of the missions that took slowest or fastest time to complete in average.
**Key Metrics Included:**
* Mission details - Mission ID, Mission Name
* Started - number of Missions that started during the filtered period.
* Unique Users - count of unique users that started the mission during the filtered period.
* Duration, avg (day:hour:min:sec) - the average length of the Mission
{% hint style="info" %}
**Value to You:**
* Identify Content Sweet Spots: Highlight the "Fastest" missions to understand which quick-win tasks drive immediate gratification and high turnover.
* Detect Progression Blocks: Pinpoint "Slowest" missions where the average duration may be excessive, signalling potential player fatigue or overly demanding requirements.
{% endhint %}
### Section 3: Base Metrics aggregations.
This section shows a set of Mission related KPIs aggregated per: Brand, Mission Type, Single Mission.
{% hint style="info" %}
**Value to You:**
* Brand-Level Efficiency: Evaluate how missions perform across different brands to identify which environments have the highest KPIs.
* Optimize Mission Type Strategy: Compare the effectiveness of Recurring, Generally Available, and Recurring upon completion missions to determine the best structure for long-term retention.
* Perform Individual Mission Audits: Drill down into the performance of Single Missions to pinpoint high-performing content that should be replicated or low-performing tasks that require adjustment.
### Section 4: Mission Efficiency & Pipeline Heatmaps
In addition to the overall participant activity heatmap, this section provides two specialized heatmaps:
* **Completion Heatmap (Efficiency Profile):** Measures the conversion rate and completion probability based on the specific weekday and hour when a mission was started.
* **Progression Heatmap (Pipeline Status):** Measures the openness ratio (percentage of missions started at a specific time that remain in progress and unresolved).
{% endhint %}
## Analytical Data tab
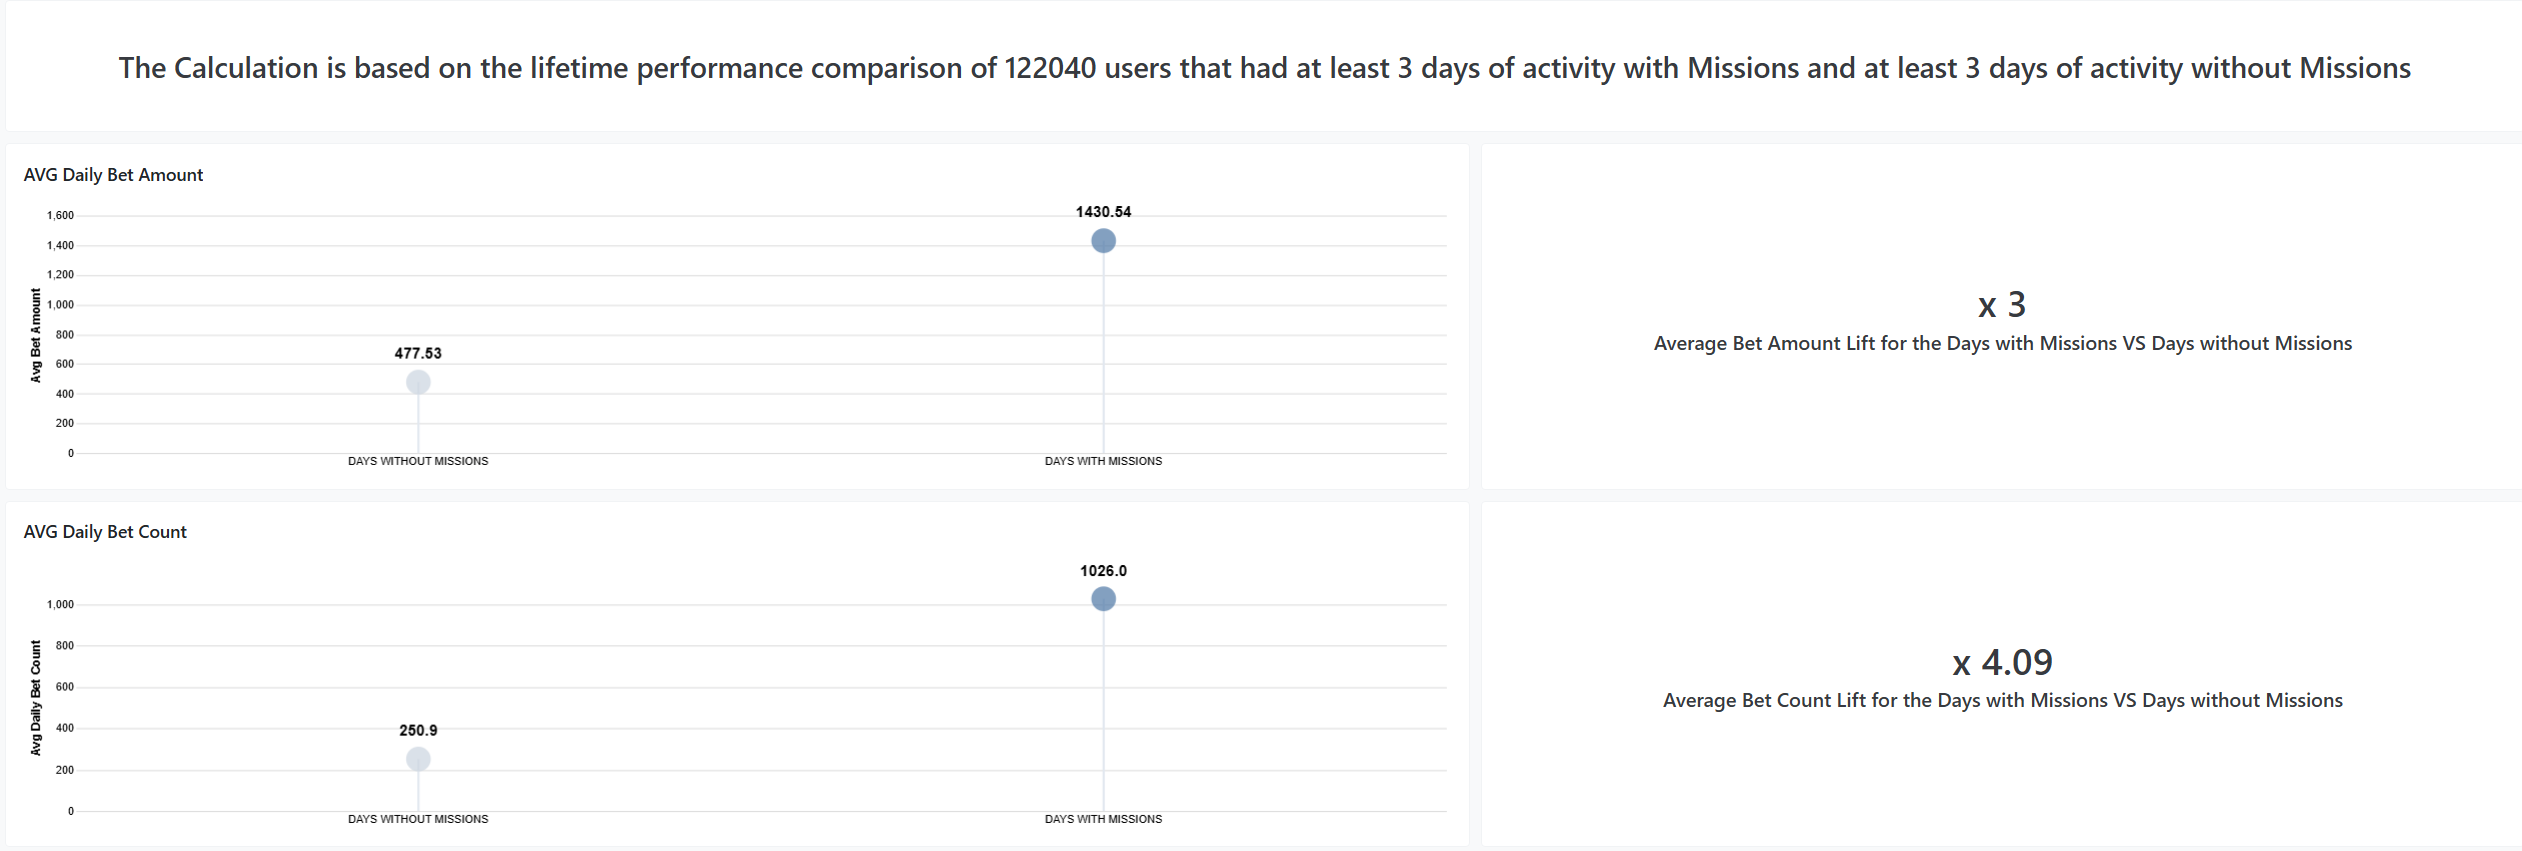
### AVG Daily Bets & Deposits (Amount and Count)
This section compares between the days with Mission Activity and the days without the Mission Activity.
**Key Concept:**
The analysis considers the core population of users who had at least 3 days with Mission activity and at least 3 days without Mission activity over a rolling 180-day window. For these users, it measures the Average Daily Bet Amount, Average Daily Bet Count, Average Daily Deposit Amount, and Average Daily Deposit Count during each period, presenting the direct comparison between active and inactive days.
{% hint style="info" %}
**Value to You:**
* Quantify Gamification Lift: Directly measures the "Mission Effect" by comparing the same user's betting volume and frequency on days they engage with missions versus days they do not.
* Validate High-Value Activity: Determines if mission participation leads to a higher Average Daily Bet Amount, justifying the cost of rewards through increased turnover.
## Tasks KPIs tab
This tab provides detailed operational performance and completion statistics broken down by individual tasks within missions and badges.
**Key Metrics & Tables:**
* **Tasks per Mission Breakdown:** Lists each mission and its constituent tasks, showing total task starts, task completions, and the task completion conversion rate.
* **Task Duration & Drop-off Analysis:** Helps identify specific bottleneck tasks where users slow down or abandon multi-step missions.
{% hint style="info" %}
**Value to You:**
* Granular Optimization: Identify difficult or low-converting individual tasks inside multi-task missions without having to guess which specific step caused player drop-off.
* Content Tuning: Rebalance task target values, bet amounts, or required action counts based on empirical completion rates per task.
{% endhint %}
{% endhint %}
## Frequently Asked Questions
### Does the Missions Dashboard include Badges data?
Yes. The dashboard covers both Missions and Badges. By default, the **Product Type** filter is set to "Mission", but you can switch it to "Badge" or select both to inspect Badges gamification performance.
### When are mission completions counted in daily completion trends?
Completions are counted on the **start date** of the mission, rather than the completion date. If a player starts a mission on January 1 and completes it on January 5, the completion is attributed to January 1 to accurately measure the conversion cohort of that start day.
### Why do some mission completions or rewards appear in player profiles before the dashboard updates?
Player profiles in the Back-Office display real-time transactional data. The Missions & Badges Dashboard aggregates analytical data through scheduled data pipelines, so new completions and reward claims appear after the periodic warehouse synchronization runs.
### What is the historical lookback period for the dashboard trends?
To ensure high query performance, trend charts on the General Stats tab utilize a rolling 90-day lookback window, while the user behavioral comparison on the Analytical Data tab is computed over a rolling 180-day window.
### Can I filter by my internal player ID or external casino user ID?
Yes. The filter bar includes both **User ID** (Smartico internal ID) and **Ext User ID** (operator platform user ID), allowing you to look up specific players using either identifier.
---
# Agent Instructions
This documentation is published with GitBook. GitBook is the documentation platform designed so that both humans and AI agents can read, navigate, and reason over technical content effectively. Learn more at gitbook.com.
## Querying This Documentation
If you need additional information that is not directly available in this page, you can query the documentation by asking a question.
Perform an HTTP GET request on the following URL with the `ask` and `goal` query parameters:
```
GET https://help.smartico.ai/welcome/products/bi-and-reporting/missions-dashboard.md?ask=&goal=
```
`ask` is the immediate question: it should be specific, self-contained, and written in natural language.
`goal` is what the user is ultimately trying to achieve, the reason they need the answer. Sharing it helps GitBook give you a better, more relevant answer. A goal is most helpful when it describes the outcome the user wants rather than restating the question. For example, with `ask=how do I create an API token`, a goal like `automate deployments from our CI pipeline` lets GitBook tailor the answer to that use case.
The response will contain a direct answer to the question and relevant excerpts and sources from the documentation.
Use this mechanism when the answer is not explicitly present in the current page, you need clarification or additional context, or you want to retrieve related documentation sections.