> For the complete documentation index, see [llms.txt](https://help.smartico.ai/welcome/llms.txt). Markdown versions of documentation pages are available by appending `.md` to page URLs; this page is available as [Markdown](https://help.smartico.ai/welcome/products/bi-and-reporting/minigames.md).
# Minigames
## 📘 Overview
The Minigames Report provides trends and product analysis for your Minigames KPIs. This report is divided into two tabs:
* General Stats
* Performance
It’s designed to help you in monitoring, managing and optimizing your business usage of the Minigames product, and make data-driven decisions.
**🔍 How to Access the Minigames Report**
1. Navigate to Reports → Gamification → Mini Games
2. Select from the available dashboard filters:
1. Date (Period — default: past 15 days)
2. MG Type
3. MG Name
4. User ID
5. RFM Segment
6. Value Score
7. Prediction Date (for MatchX predictions)
**The Report consists of 4 tabs:**
1. **Summary** - provides high-level comparison cards evaluating player performance on minigame days versus non-minigame days.
2. **General Stats** - focuses on overall stats, penetration funnels, buy-in costs, RFM distribution, and daily engagement trends.
3. **Analytical Data** - provides deep behavioral insights comparing same-day, pre/post minigame engagement, RFM effectiveness scores, and game quality rankings.
4. **MatchX** - tracks player prediction activity, template popularity, and value score distributions for sports prediction minigames.
## Summary tab:
We’ve introduced a clear overview, comparing average performances of the users during the days when they engaged in any Minigame activity VS. the days without any Minigame activity.
**Key Metrics Included:**
* Bet Amount
* Bet Count
* Active Hours - hours during which the user placed a bet.
## General Stats tab:
### Section 1: KPIs & Charts
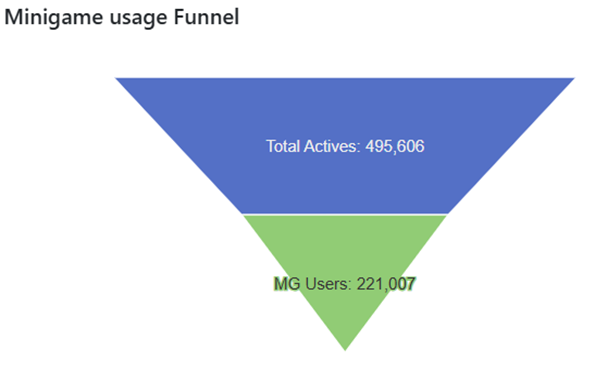
We’ve introduced a funnel comparing the share of total active players who also engaged in minigames during the chosen period.
**Key Metrics Included:**
* Total Actives (unique count of players that had either bet or deposit during the period in question)
* MG Users (unique count of players that had a gaming activity on the Minigames during the period in question)
{% hint style="info" %}
**Value to You:**\
This chart shows the minigames’ penetration within the overall active base and highlights adoption. A low conversion rate may signal weak minigame appeal, while an upward trend suggests minigames are becoming a stronger engagement driver.
{% endhint %}
### Section 2: Depositors VS. Non-Depositors split of Minigame Actives
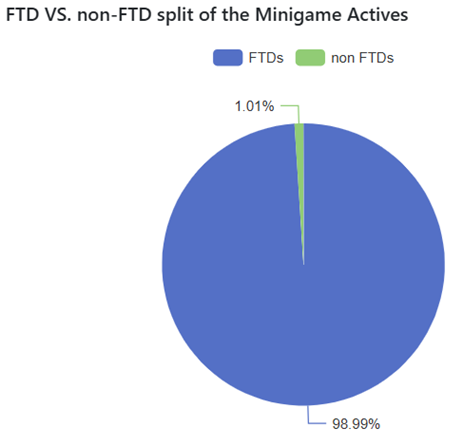
This section shows how minigame activity is distributed between depositing players (users with at least one deposit) and non-depositing players during the chosen period.
**Key Distribution Included:**
* Total Active MG Users (for the chosen filters) distributed between the players that had at least one deposit and the players that hadn't deposited yet.
{% hint style="info" %}
**Value to You:**\
With these views, you can identify whether the minigames are being offered to revenue-generating players or mainly free/non-depositing users.
If most activity comes from FTDs, minigames reinforce monetization; if non-FTDs dominate, they may serve more as an engagement or acquisition tool.
{% endhint %}
### Section 3: Minigames Cost\* split per Minigame types
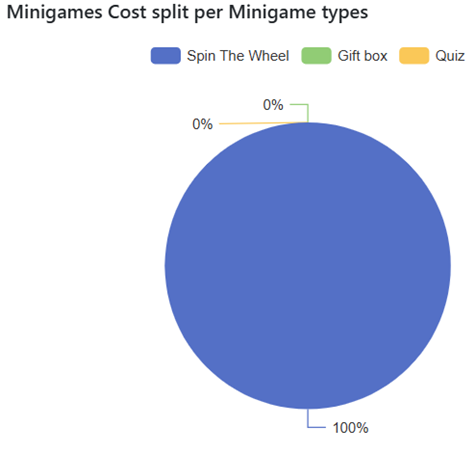
This section shows how total Minigame Costs are distributed across different minigame types. The Minigame Cost refers to the value of the Minigame buy-in points.
**Key Metrics and Distribution Included:**
* The chart shows how total minigame costs are distributed across different minigame types.
{% hint style="info" %}
Value to You:\
This chart helps identify which game formats drive the largest share of expenses.
If one type consumes most of the budget but delivers low engagement, it may need optimization; balanced cost distribution suggests diversified investment.
{% endhint %}
### Section 4: Minigame Active players VS. Total Active players distribution per RFM Segment
This section introduces a chart showing the proportion of minigame activity versus total activity across different RFM (Recency, Frequency, Monetary) as well as the Value Score segments.
**Key Visualization:**
100% stacked chart, showing on one hand the split of the Minigame Users between the different RFM and the Value Score Segments and on the other hand the split of all the Active Users between the different RFM and the Value Score Segments (as a benchmark).
{% hint style="info" %}
**Value to You:**\
This section helps you to identify which player segments are most engaged with minigames relative to their overall activity.
For example, if high-value segments dominate minigame activity, minigames support monetization; if low-value segments dominate, they may primarily drive engagement or retention.
{% endhint %}
### Section 5: Daily Trend of the Total Active Players VS. Minigame Active Players
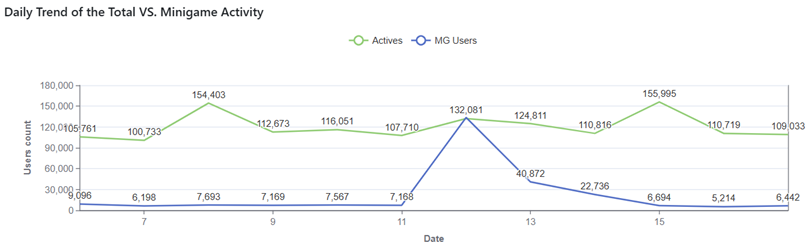
This section introduces a time-series chart comparing overall platform activity with minigame-specific activity on a daily basis.
**Key Visualization:**
A Daily trends of the unique Players, having either Bet or Deposit on each day VS. a daily trend of the unique players having a Minigame bet on each day.
{% hint style="info" %}
**Value to You:**\
This section shows how minigames contribute to total engagement and whether their usage follows or diverges from overall trends.
{% endhint %}
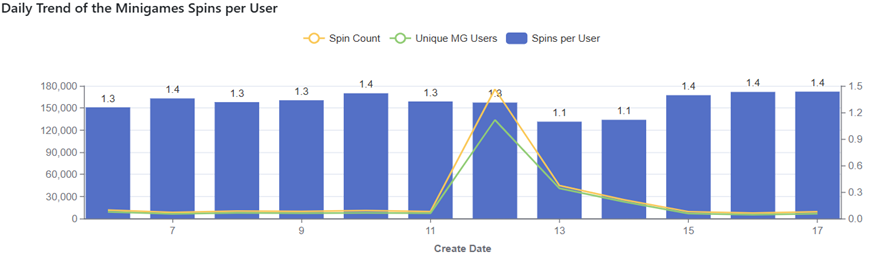
### Section 6: Daily Trend of the Minigames Spins per Minigame User
This section introduces a daily trend chart showing the average number of minigame spins per active user.
**Key Visualization:**
Daily trends of the unique Minigame Bettors, Total Spins Count and the Spins Count per Minigame User .
{% hint style="info" %}
**Value to You:**\
This section quantifies the stickiness of the gamification ecosystem by measuring player interaction depth beyond simple participation.
A rising ratio confirms that game content is effectively retaining player interest.
### Section 7: Spins Volume Split by Minigame Type
This section displays a breakdown of total spin volume across all active minigame formats (such as Spin the Wheel, Scratch Card, Gift Box, MatchX, and Quiz).
### Section 8: Daily Trend of Minigame Active Users and Cost per User
This dual-axis chart tracks daily active minigame participants alongside the average buy-in points cost incurred per active player.
{% hint style="info" %}
**KPI Glossary:**
* **Active Players:** Unique players who placed a bet or made a deposit during the period.
* **Minigame Active Players:** Unique players who participated in at least one minigame.
* **Minigame Cost:** Total gamification points spent by users on paid minigame buy-ins.
{% endhint %}
{% endhint %}
## Analytical Data tab
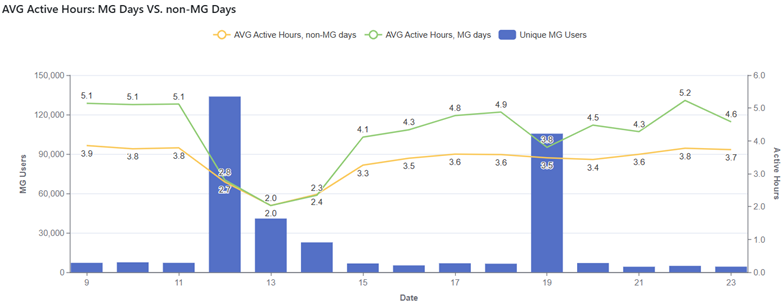
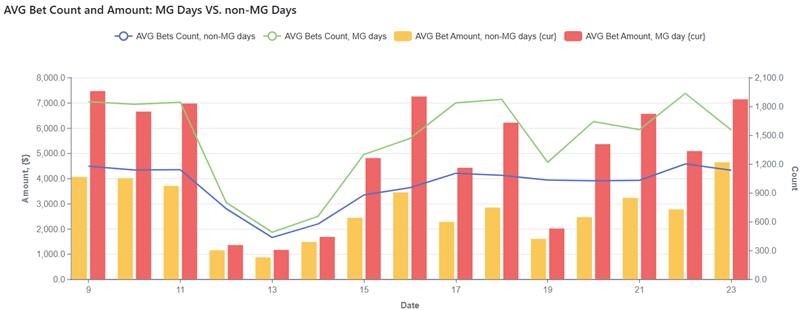
### Section 1: AVG Active Hours: MG Days VS. non-MG Days & AVG Bet Count and Amount: MG Days VS. non-MG Days
We’ve introduced charts comparing Minigame users’ AVG Active Hours and AVG Bet Count & Amount on days with minigame activity vs. days without the Minigame Activity.
**Key Metrics Included:**
* The KPIs in charts are measured for the Players that were active on Minigames during each day, comparing their Minigame average values on that day to their average baseline values during the 30 days prior when not playing minigames. In order to compare "apples to apples", the measured KPIs exclude the minigame activity itself, ensuring any observed increase reflects downstream impact on core gaming wagering.
{% hint style="info" %}
**Value to You:**\
This chart shows whether the minigames directly influence same-day core casino engagement and monetization, beyond their own gameplay.
Higher active hours on MG days → minigames extend overall play sessions.
Increased bet count/amount on MG days → minigames stimulate additional wagering.
No change or decline → minigames serve more as entertainment than immediate revenue drivers.
{% endhint %}
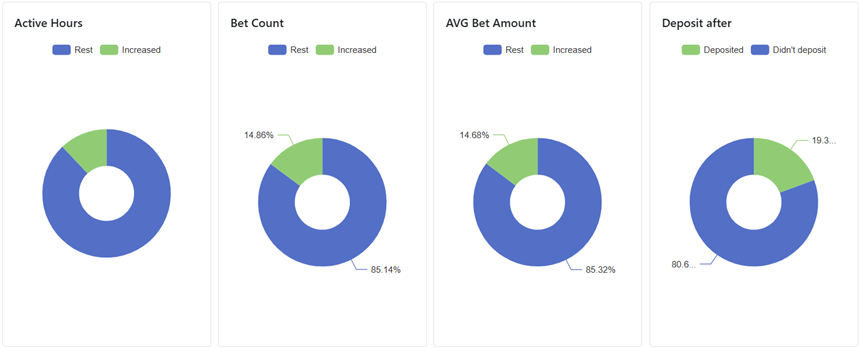
### Section 2: Players' behaviour a day before the Minigame activity VS a day after the Minigame activity.
We’ve introduced charts comparing Minigame users’ AVG KPIs during the day before the Minigame Activity to the Minigame users' AVG KPIs during the day after the Minigame Activity.
**Key Metrics Included:**
* This set of pie charts shows the share of players whose activity (Active Hours, Bet Count, Average Bet Amount, Deposits) increased a day after participating in a minigame compared to the day before participating in a minigame.
{% hint style="info" %}
**Value to You:**\
These charts capture the short-term impact of minigames on player engagement and monetization.
A high share of players increasing deposits or bet activity post-minigame suggests strong uplift effect; low changes may imply minigames work more as entertainment than revenue drivers.
{% endhint %}
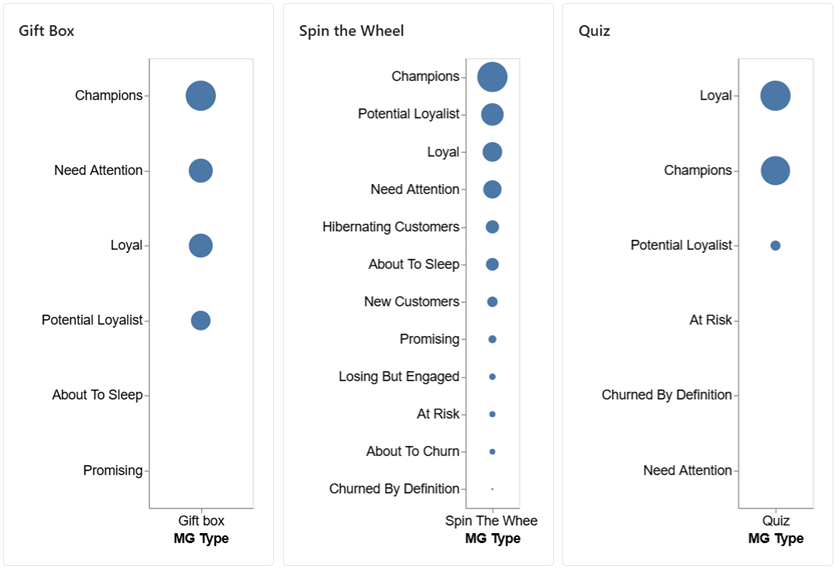
### Section 3: Charts showing the RFM Effectiveness per Minigame Type.
We’ve introduced charts, ranking which RFM segments perform best for each minigame type.
**Key Metrics Included:**
* The Minigames Effectiveness Score, which is measured by calculating the players gaming and wallet activity before the minigame activity VS. after the minigame activity. The higher the score - the better the players' behaviour following the engagement with minigame.
The split and grading of Minigame Types per RFM Segment based on this Effectiveness Score shows which combination is optimal for maximizing player value.
{% hint style="info" %}
**Value to You:**\
These charts help identify which player groups respond most effectively to specific minigame formats.
If high-value segments excel in specific minigames types but low-value ones in other minigame types, your business can tailor minigame type offerings by segment to maximize impact.
{% endhint %}
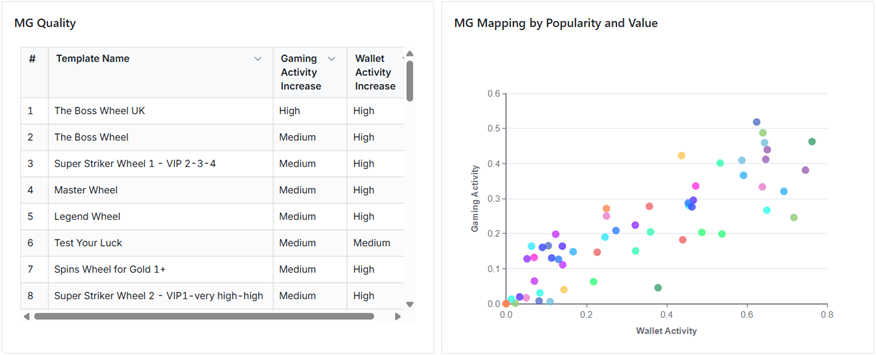
### Section 4: Minigame Gaming and Wallet quality Table & Minigame Gaming and Wallet quality Chart
We’ve introduced a table and a scatter chart measuring how each minigame influences core gaming activity or wallet actions (deposits).
**Key Metrics Included:**
* Calculating the activity optimization split by activity type (Gaming Activity = Bet and Wallet Activity = Deposit) and by Specific Game allows you to pick the right game for boosting the relevant KPI and reach the business targets.
The Table shows the Games grading by Activity Increase type and Increase Tier (Low/Medium/High), while the Scatter Chart shows a more graphic view of this analysis.
{% hint style="info" %}
**Value to You:**\
These charts show which minigames drive meaningful downstream behaviour beyond just engagement.
A minigame strongly linked to higher deposit activity is valuable for monetization, while one boosting gaming activity may be better suited for retention.
## MatchX tab
The MatchX tab monitors player prediction participation, tournament popularity, and value distribution across sports prediction and quiz minigames.
### Section 1: Users with Prediction Attempts — Daily Trend
Tracks the daily count of unique players submitting MatchX predictions alongside the average number of prediction attempts per participant.
### Section 2: Users Distribution per Template
Displays player participation across individual sports prediction and quiz game templates, identifying the most engaging competitions.
### Section 3: Value Score Distribution per Template
Analyzes the player value tier composition (30-day value score segments) participating in each prediction template.
### Section 4: Value Score Distribution
Provides an overall distribution breakdown of MatchX participants across player value score tiers to evaluate audience quality.
## ❓ Frequently Asked Questions
### What does "Minigame Cost" include?
"Minigame Cost" represents the total value of gamification loyalty points spent by players to purchase minigame attempts (buy-in points). It does not include free spin tickets awarded through CRM campaigns, mission rewards, or level progression.
### How is the 30-day baseline in the Analytical Data tab calculated?
The baseline compares a player's core casino wagering activity on days they played minigames against their 30-day moving average on days without any minigame activity. This ensures that observed uplifts reflect true incremental engagement rather than activity from the minigame itself.
### How is the Minigame Effectiveness Score determined?
The score is a composite metric evaluating whether players increase their active hours, bet count, and bet amount by more than 10% on the day after playing a minigame compared to the day before, combined with next-day deposit conversion rates.
### Where can I configure minigames, custom skins, or award free spins?
To create and configure minigames, manage custom skins, or set up automated campaigns awarding minigame spins, visit the [Mini Games](https://help.smartico.ai/welcome/products/mini-games) and [Match X](https://help.smartico.ai/welcome/products/mini-games/matchx-game) setup guides.
{% endhint %}
---
# Agent Instructions
This documentation is published with GitBook. GitBook is the documentation platform designed so that both humans and AI agents can read, navigate, and reason over technical content effectively. Learn more at gitbook.com.
## Querying This Documentation
If you need additional information that is not directly available in this page, you can query the documentation by asking a question.
Perform an HTTP GET request on the following URL with the `ask` and `goal` query parameters:
```
GET https://help.smartico.ai/welcome/products/bi-and-reporting/minigames.md?ask=&goal=
```
`ask` is the immediate question: it should be specific, self-contained, and written in natural language.
`goal` is what the user is ultimately trying to achieve, the reason they need the answer. Sharing it helps GitBook give you a better, more relevant answer. A goal is most helpful when it describes the outcome the user wants rather than restating the question. For example, with `ask=how do I create an API token`, a goal like `automate deployments from our CI pipeline` lets GitBook tailor the answer to that use case.
The response will contain a direct answer to the question and relevant excerpts and sources from the documentation.
Use this mechanism when the answer is not explicitly present in the current page, you need clarification or additional context, or you want to retrieve related documentation sections.