> For the complete documentation index, see [llms.txt](https://help.smartico.ai/welcome/llms.txt). Markdown versions of documentation pages are available by appending `.md` to page URLs; this page is available as [Markdown](https://help.smartico.ai/welcome/products/bi-and-reporting/bonus-cost.md).
# Bonus Cost
## 📘 Overview
The Bonus Cost Analysis Dashboard provides a detailed analysis of your bonus activity, allowing you to track performance, costs, and player engagement. In the Back-Office, this dashboard is organized into five functional tabs: General Stats, Operational Data, Analytical Data, Detailed Bonus Data, and Bonus Share Model.
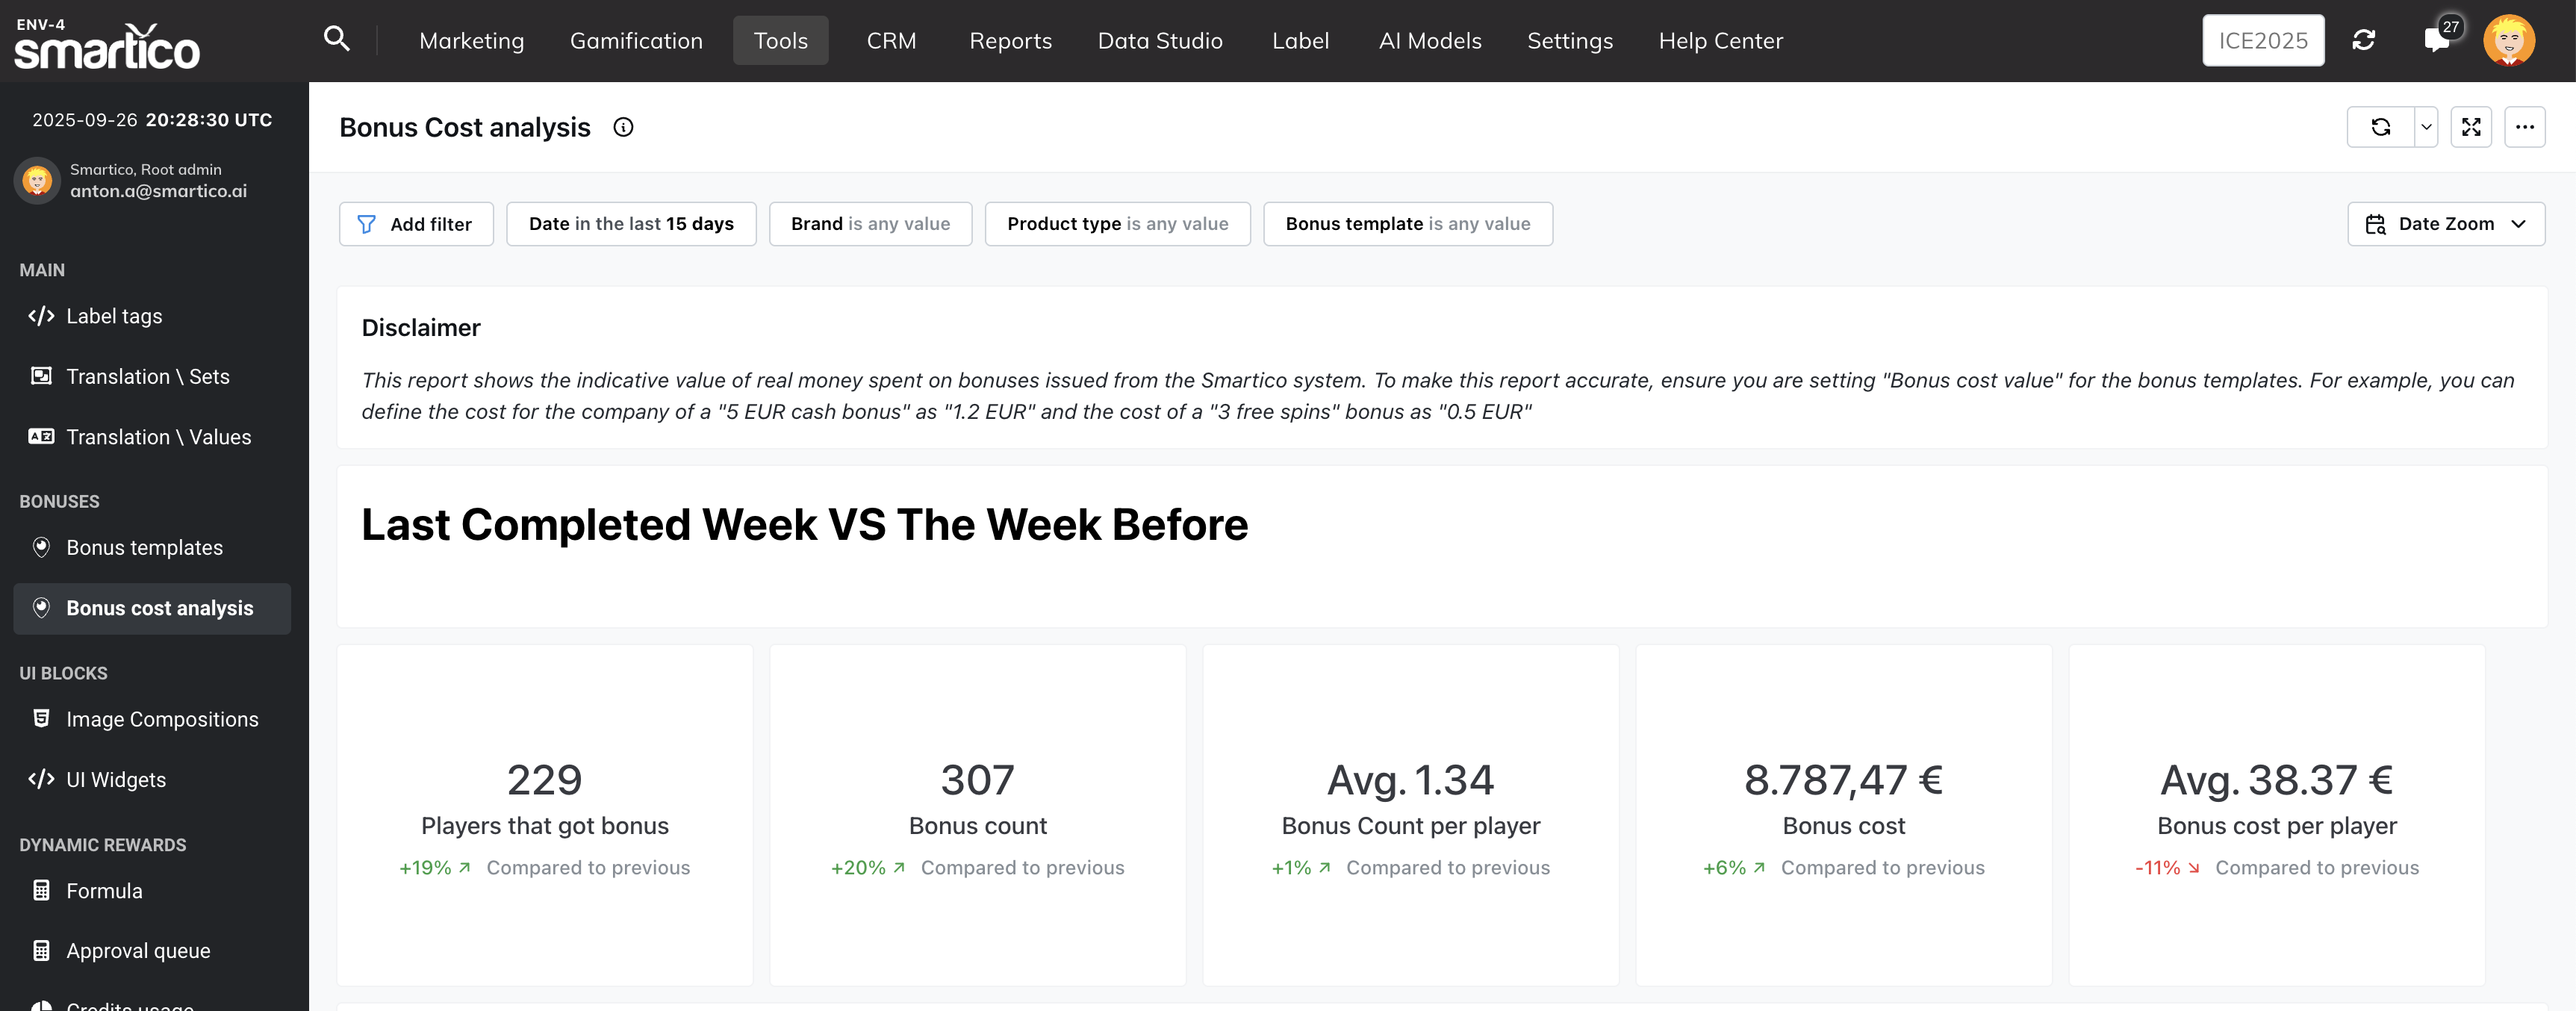
* Last Completed Week vs. The Week Before
* Aggregated KPIs
* Daily Trends
* Bonus Distribution Insights
* Bonus Quality Indicators
It’s designed to help you monitor bonus performance across time, segments, platforms, and regions, identify trends, and make data-driven decisions to optimize your bonus strategy.
**🔍 How to Access the Bonus Cost Report**
1. Navigate to Tools → Bonuses → Bonus cost analysis
2. Select:
1. Period
2. Product Type (by player’s segmentation)
3. Bonus Template (upon need)
3. Explore the Dashboard for detailed insights.
{% hint style="info" %}
**Prerequisite — Bonus Cost Configuration:**\
Bonus cost is not calculated automatically from game activity. Smartico calculates financial outlay using the **Bonus cost** value configured on your Bonus Templates or reward activities in your brand's default currency. If a bonus template has no cost value defined (or is set to 0), its financial cost will appear as 0 in this report. Additionally, this dashboard strictly tracks **redeemed bonuses**; pending coupons, expired, or failed issuances are excluded from cost calculations.
{% endhint %}
**Reward-Level Cost Overrides:**\
You can also set a custom **Bonus cost** directly inside campaign actions (such as Give Bonus), minigame prize tiers, tournament rewards, and store items. When defined at the reward level, this custom value overrides the default cost configured on the bonus template.
### Template-Level Bonus Analytics
In addition to the main dashboard, Smartico provides a dedicated **Bonus Cost Analysis (Bonus Level)** view directly inside each bonus template:
1. Navigate to **Tools → Bonuses → Bonus templates**.
2. Click to edit any bonus template.
3. Open the **Analytics** tab to view performance metrics scoped specifically to that individual template, including total cost, unique recipients, and gameplay return.
### Related Guides
* For configuring bonus templates and issuance rules, see [Bonuses Overview](https://help.smartico.ai/welcome/products/general-concepts/bonuses).
* For technical details on integrating bonus awards with external gaming platforms, see [Bonus API Integration](https://help.smartico.ai/welcome/technical-guides/bonus-api-integration).
* For tracking dynamic formula-based credits, see [BI & Reporting](https://help.smartico.ai/welcome/products/bi-and-reporting).
### Section 1: Last Completed Week vs. The Week Before
We’ve introduced a comparative view that highlights the week-over-week performance of your bonus activity. This section allows you to quickly identify trends and shifts in player engagement and bonus allocation.
**Key Metrics Included:**
* Players that received a bonus – total number of unique players rewarded.
* Bonus count – total number of bonuses issued.
* Bonuses per player – average number of bonuses received per player.
* Total bonus cost – total financial outlay for issued bonuses.
* Bonus cost per player – average spend per player receiving a bonus.
### Section 2: Aggregated KPIs
This section allows you to observe the aggregation of the bonus related KPIs.
**Key Metrics Included:**
* Players that received a bonus – total number of unique players rewarded.
* Bonus count – total number of bonuses issued.
* Bonuses per player – average number of bonuses received per player.
* Total bonus cost – total financial outlay for issued bonuses.
* Bonus cost per player – average spend per player receiving a bonus.
{% hint style="info" %}
**Value to You:**\
This section presents the total measures based on the filters applied to the dashboard.
{% endhint %}
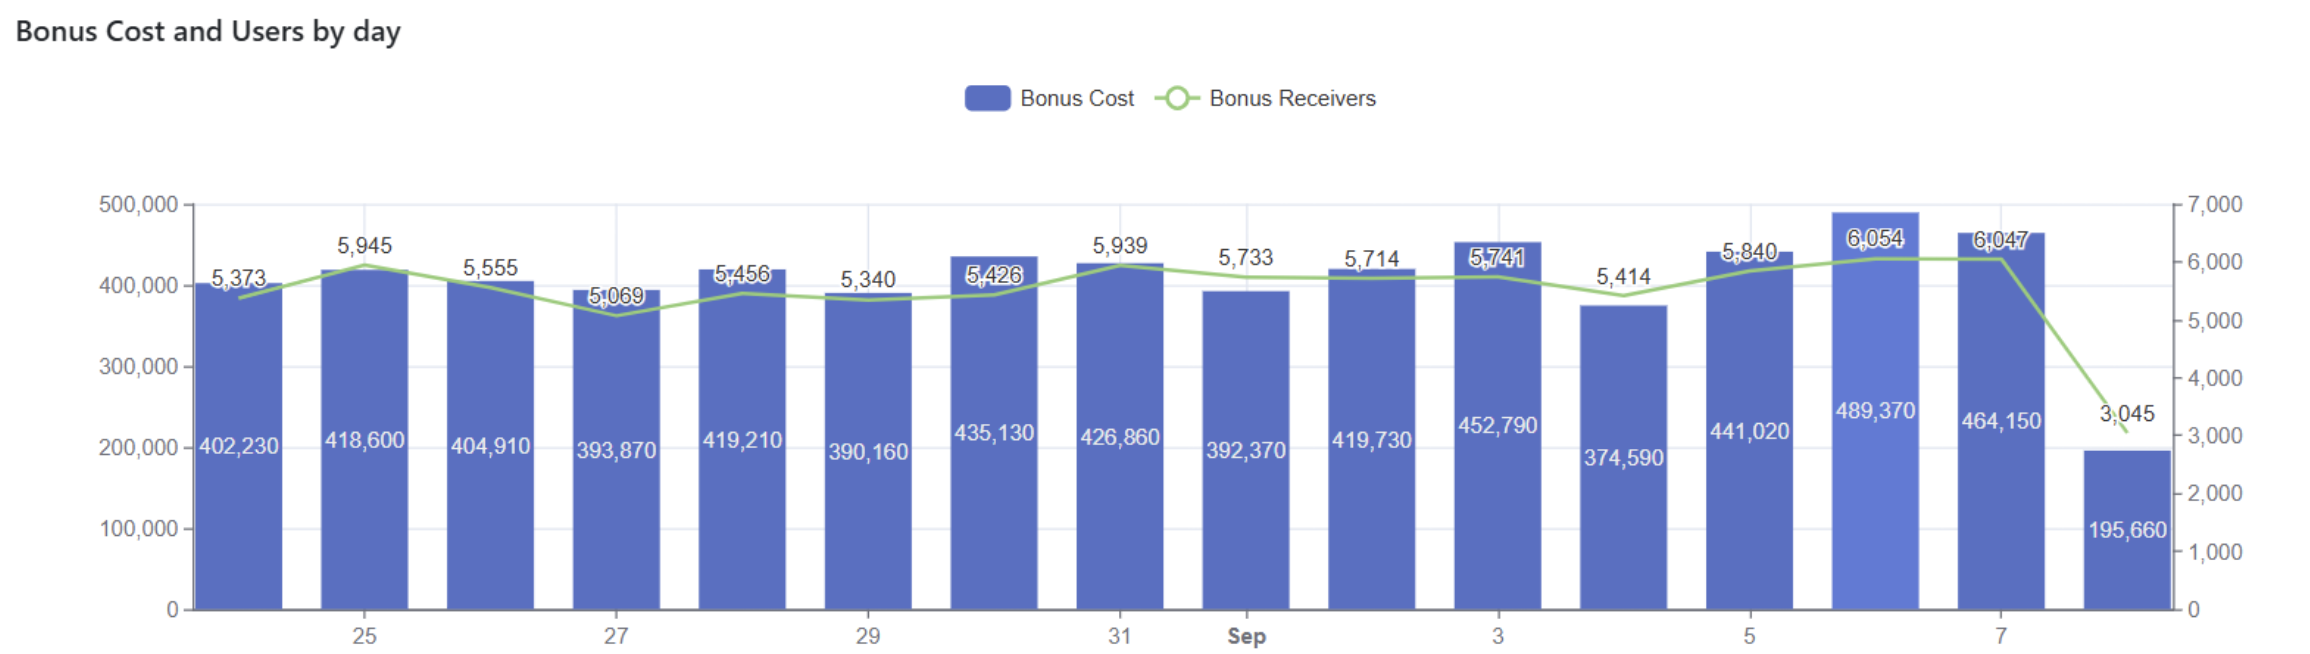
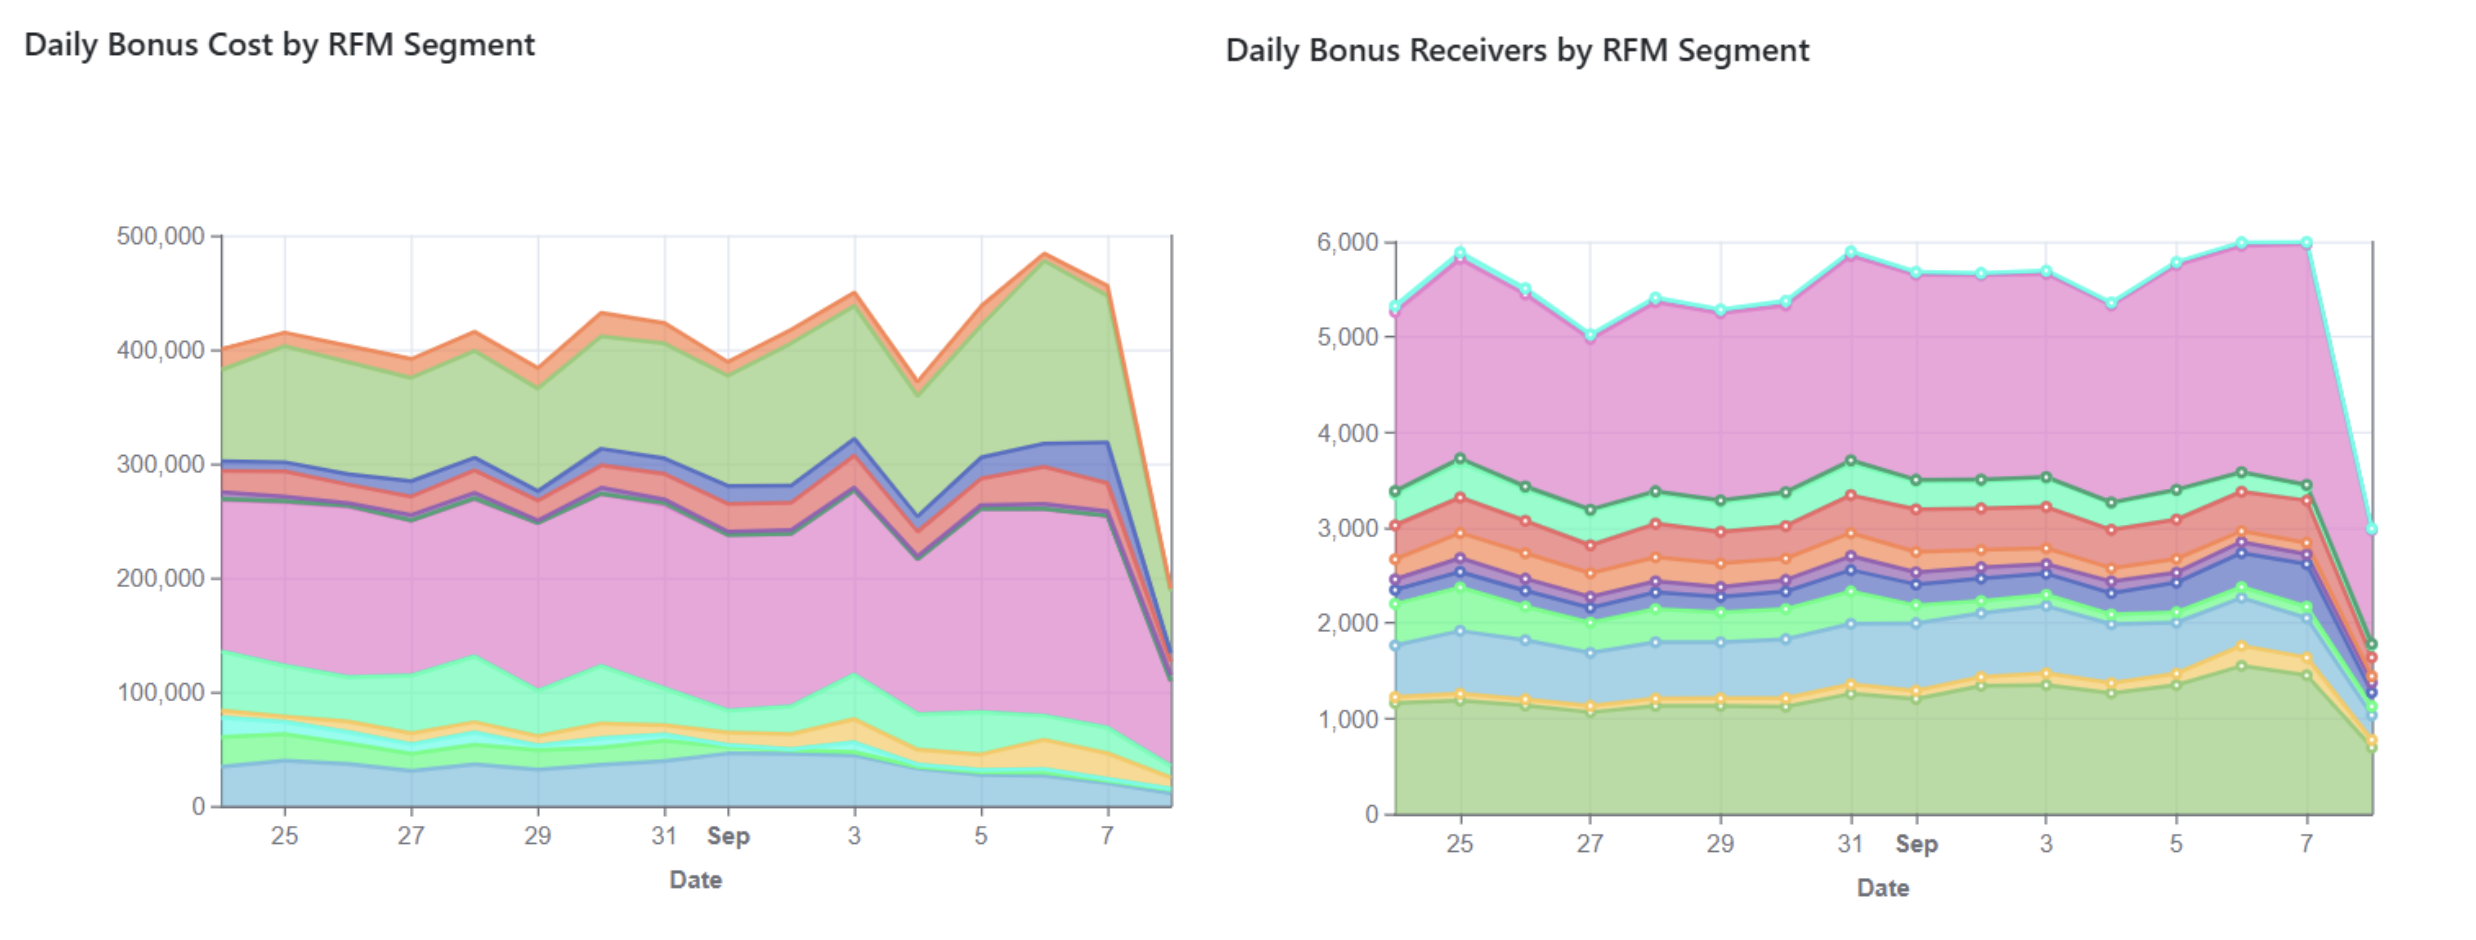
### Section 3: Daily Trends
This section provides a day-by-day breakdown of bonus activity, allowing you to monitor fluctuations in cost and player engagement with greater granularity.
**Key Visualizations:**
1. **Daily Bonus Cost and Daily Bonus Receivers** – a combined chart that tracks both the total spend on bonuses and the number of players receiving them each day.
2. **Daily Bonus Cost by RFM Segments** – shows how bonus spending is distributed across player value segments on a daily basis.
3. **Daily Bonus Receivers by RFM Segments** – highlights how many players in each segment are engaging with bonuses each day.
{% hint style="info" %}
**Value to You:**\
With these views, you can identify peak activity days, assess campaign effectiveness, and detect early signals of changing player behavior. The RFM segmentation adds another layer of insight, allowing you to understand which player groups are driving costs and engagement, and to optimize bonus strategies accordingly.
{% endhint %}
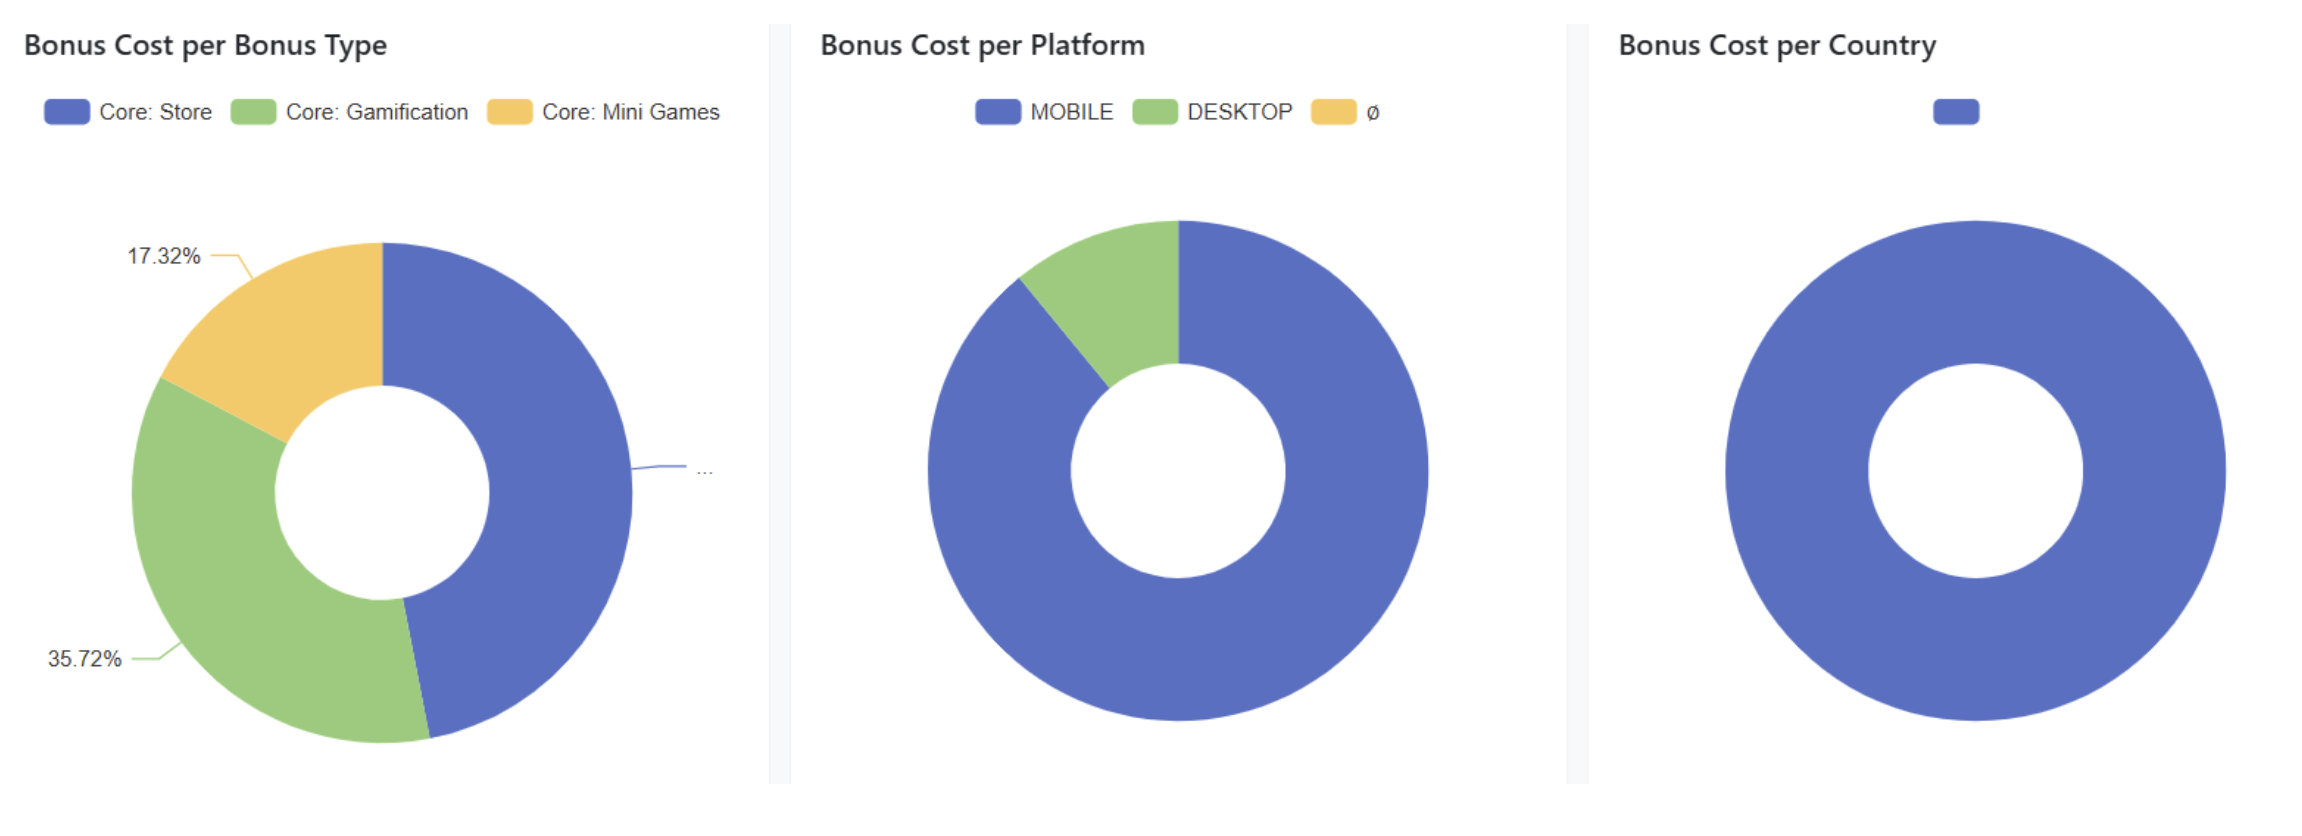
### Section 4: Bonus Distribution Insights
This section provides a multi-dimensional view of how bonuses are allocated and consumed, helping you understand cost drivers and engagement patterns across different categories.
**Key Visualizations:**
* Bonus Cost per Bonus Type (Pie Chart) – shows how bonus spending is distributed across the different types of bonuses.
* Bonus Cost per Platform (Pie Chart) – compares bonus spend across desktop, mobile, and other platforms.
* Bonus Cost per Country (Pie Chart) – highlights regional distribution of bonus costs, offering a geographic view of engagement.
**Key Tables:**
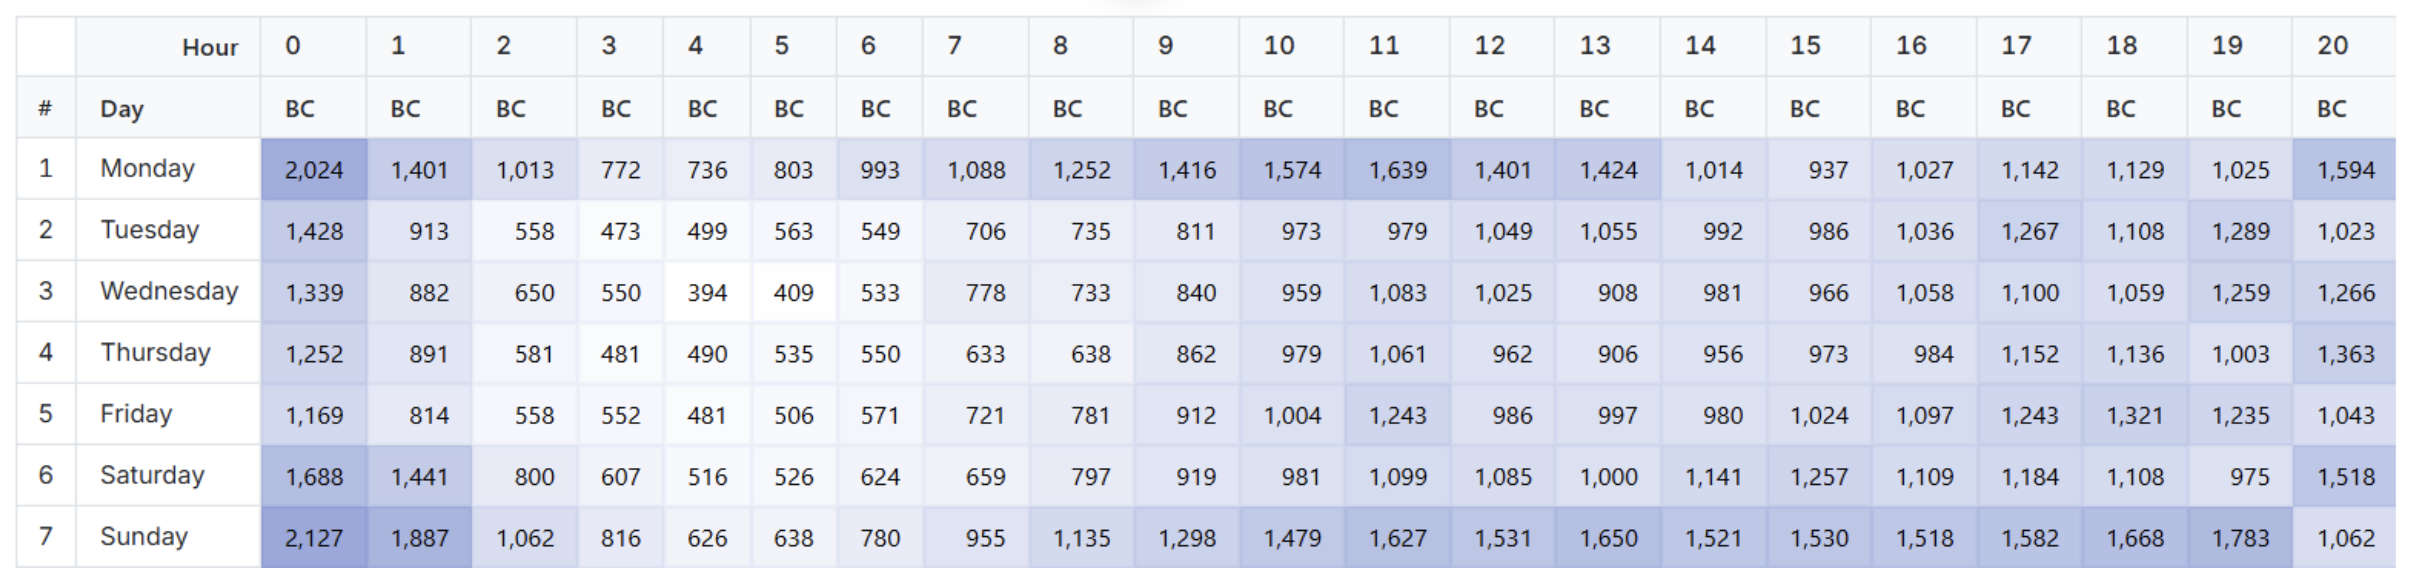
* Hourly Bonus Distribution by Weekday – presents bonus counts across each hour of the day, segmented by weekdays, to identify activity peaks.
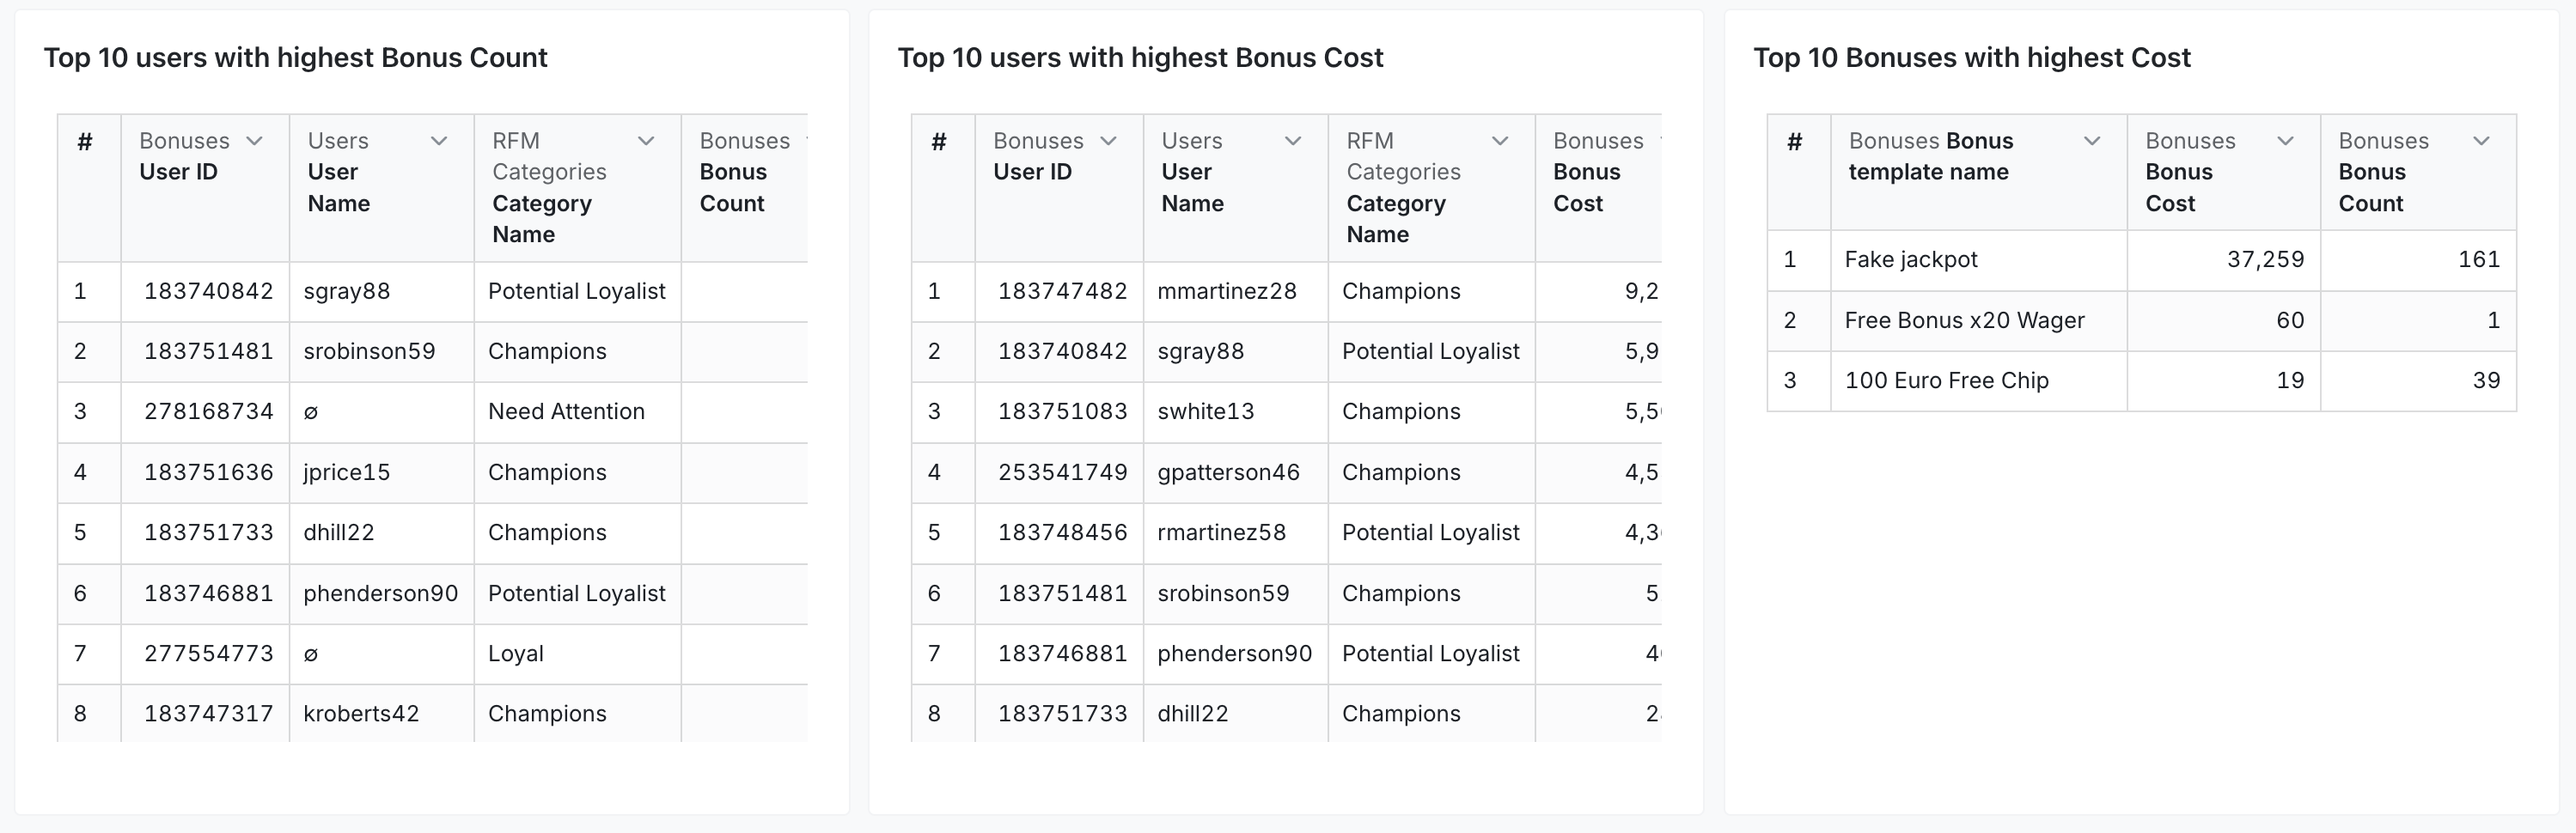
* Top 10 Users by Bonus Count – lists the players receiving the highest number of bonuses.
* Top 10 Users by Bonus Cost – highlights the players associated with the highest total bonus spend.
* Top 10 Bonuses by Cost – identifies the most expensive bonus campaigns.
{% hint style="info" %}
Value to You:\
This set of views allows you to evaluate how and where bonuses are being utilized, recognize your most impactful campaigns, and detect concentration risks (e.g., high-cost users or bonus types). With insights by time, geography, platform, and user behaviour, you can refine targeting and optimize your bonus allocation strategy.
{% endhint %}
### Section 5: Bonus Templates split by Product
The table shows the distribution of the granted bonus per different Products (Campaign/Mini Game/etc.)
Key Indicators:
* Bonus Name - the Name of the Bonus, granted to the users.
* Bonus ID - the ID of the Bonus, granted to the users.
* Product Name - the product for which the bonus was given (Mini Game / Campaign / etc.)
* Bonus Source Entity - the specific entity for which the bonus was given (Specific Name of the Mini game / Specific Store Item / etc.)
* Bonus Cost - the monetary value of the Bonus
* Bonus Receiver - the count of the users that received the Bonus.
{% hint style="info" %}
**Value to You:**\
This section can assist in guiding the budget reallocation to the highest-performing product templates.
{% endhint %}
### Section 6: Bonus Quality Indicators
This section introduces a performance-focused perspective, linking bonus activity to key revenue metrics. It helps you assess not only how bonuses are distributed, but also how effective they are in driving player value.
**Key Visualizations:**
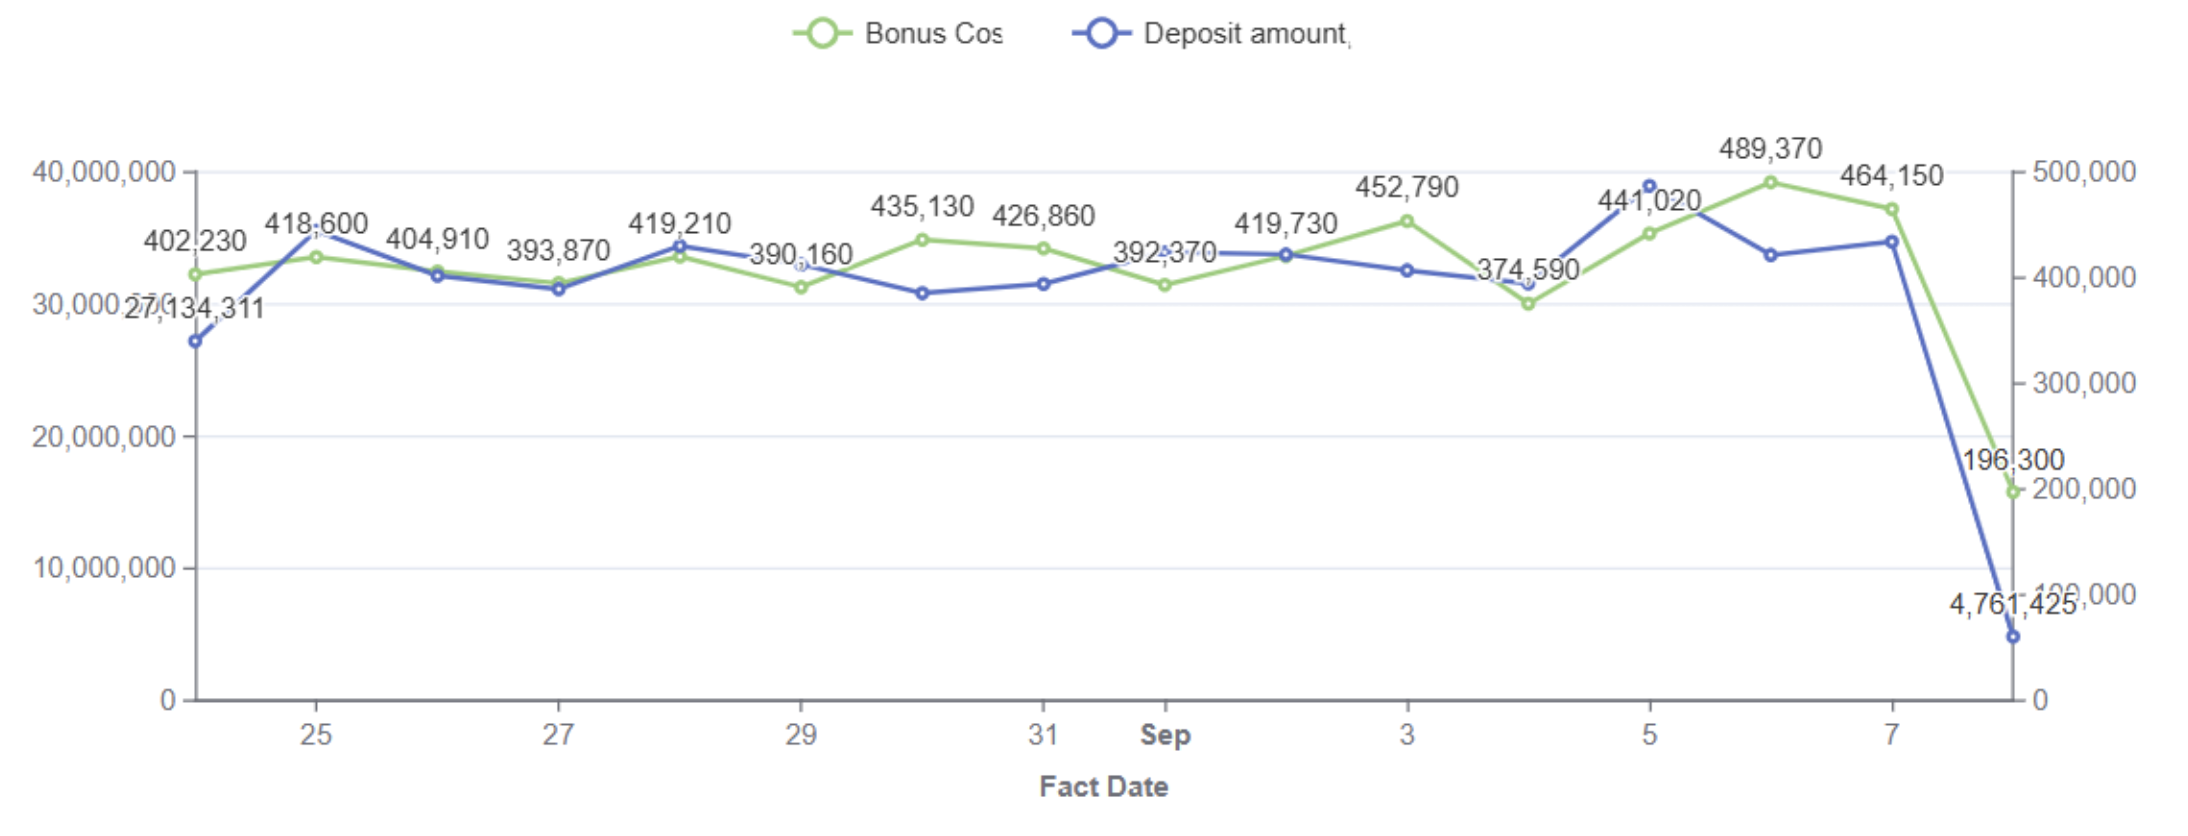
Daily Line Chart for Bonus Count and Deposit Amount – tracks the relationship between the number of bonuses granted and the corresponding deposit volumes over time.
**Key Table:**
* **Bonus Receivers Stats per Bonus** – provides a detailed view of each bonus with the following KPIs:
* Bonus Template Name
* Bonus Total Cost
* Bonus Receivers
* Bonus Cost per Bonus Receiver
* Bonus Cost per Bonus Receiver
* GGR per Bonus Receiver
* NGR per Bonus Receiver
{% hint style="info" %}
**Value to You:**\
This section helps you evaluate the quality and efficiency of your bonuses, linking them directly to revenue outcomes. You can identify which bonuses deliver the best return, compare costs against player deposits, and refine your incentive strategy to maximize profitability.
{% endhint %}
### Section 7: Detailed Bonus Data
The Detailed Bonus Data tab provides granular breakdown tables across the different channels and features that award bonuses:
* **Bonus Activity Resources** – tracks bonus issuance volume, costs, and unique player counts grouped by Bonus Template, Source Entity (such as specific campaigns, minigames, or store items), and issuance status.
* **Bonuses by Campaign** – provides a detailed breakdown of bonus costs and recipient counts per marketing campaign.
* **Gamification Bonuses** – breaks down bonuses awarded through gamification mechanics, including Missions, Tournaments, Minigames, Levels, Badges, and the Reward Store.
* **Dynamic Bonuses** – monitors formula-driven dynamic rewards and credit usage.
### Section 8: Bonus Share Model
The **Bonus Share Model** evaluates how much of a player's recent wagering (last 30 days) was funded by bonus funds versus real money deposits. It provides a data-driven framework to decide whether a player is ready for a new bonus offer or is still playing primarily on previous bonus funds (New Customers are excluded to prevent skew from welcome offers).
**Strategy Quadrants (Value Score vs. Bonus Share):**
1. **High Value + Low Bonus Share (Self-Funded VIPs):** High-worth players who wager predominantly their own money. Protect their experience; bonuses are optional perks rather than retention requirements.
2. **High Value + High Bonus Share (Bonus-Dependent VIPs):** Valuable players whose high wagering is heavily supported by bonuses. Monitor gross and net margins closely.
3. **Low Value + Low Bonus Share (Casual Self-Funded):** Low-touch players playing with their own funds. Engage selectively with targeted bonus incentives or gamification challenges.
4. **Low Value + High Bonus Share (Bonus Chasers):** Players betting primarily on bonus funds with low net contribution. Cap bonus spending and shift incentives toward non-cash gamification rewards.
**Actionable Tables & User Lists:**
* **Detailed Bonus Share Tiers:** Categorizes player distribution across bonus wagering tiers with color-coded risk bands (low reliance <20%, moderate 20%–50%, and high reliance >50%).
* **Bonus Share by RFM and Value Score:** Visualizes bonus dependency across standard player lifecycle segments.
* **Top 5K Users with High Bonus Share:** Actionable list of players most dependent on bonus funds for targeted rule adjustments.
* **High Value Users with Low Bonus Share:** List of top organic players for VIP relationship management.
### FAQ
**Q: Why do some bonuses show zero cost in the dashboard?**\
**A:** Bonus costs are calculated from the indicative **Bonus cost** value entered on the bonus template or campaign reward. If this field is left empty or set to 0 when creating the template, the system records 0 financial cost for issuances of that bonus.
**Q: Are failed or expired bonuses included in the cost metrics?**\
**A:** No. The dashboard only tracks **redeemed** bonuses. Bonuses with status Coupon Issued, Expired, or Failed are excluded from the cost totals and recipient counts.
**Q: How are GGR and NGR calculated in the Bonus Quality table?**\
**A:** GGR is calculated as total bets minus total wins generated by bonus recipients during the period. NGR is calculated as GGR minus the total bonus cost (Bets - Wins - Bonus Cost). Both metrics are divided by the number of unique bonus receivers to show the average net return per player.
**Q: Why don't the bottom analytical charts filter when I select a specific bonus template?**\
**A:** The charts in the Analytical Data section (such as the Bonus to Deposit correlation) are designed to provide a macro-level comparison across all bonuses and platforms, and remain aggregated across your full bonus portfolio.
**Q: How can I identify individual players who received bonuses or have high bonus dependency?**\
**A:** You can use the **Top 10 Users by Bonus Cost** table in the Operational Data tab, export lists from the **Detailed Bonus Data** tab, or review the **Top 5K Users with High Bonus Share** table in the Bonus Share Model tab.
**Q: In what currency are bonus costs displayed, and how are multi-currency players handled?**\
**A:** All bonus costs in this dashboard are aggregated and displayed in your brand's default currency. If players wager or receive bonuses in other wallet currencies, Smartico converts dynamic bonus amounts into the brand's default currency using the daily exchange rate.
**Q: If I update the Bonus Cost on a bonus template, does it retroactively update historical reports?**\
**A:** No. The bonus cost is stamped on each bonus record at the moment of issuance. Changing the bonus cost value on a template applies only to future issuances; past records retain their historical cost values.
---
# Agent Instructions
This documentation is published with GitBook. GitBook is the documentation platform designed so that both humans and AI agents can read, navigate, and reason over technical content effectively. Learn more at gitbook.com.
## Querying This Documentation
If you need additional information that is not directly available in this page, you can query the documentation by asking a question.
Perform an HTTP GET request on the following URL with the `ask` and `goal` query parameters:
```
GET https://help.smartico.ai/welcome/products/bi-and-reporting/bonus-cost.md?ask=&goal=
```
`ask` is the immediate question: it should be specific, self-contained, and written in natural language.
`goal` is what the user is ultimately trying to achieve, the reason they need the answer. Sharing it helps GitBook give you a better, more relevant answer. A goal is most helpful when it describes the outcome the user wants rather than restating the question. For example, with `ask=how do I create an API token`, a goal like `automate deployments from our CI pipeline` lets GitBook tailor the answer to that use case.
The response will contain a direct answer to the question and relevant excerpts and sources from the documentation.
Use this mechanism when the answer is not explicitly present in the current page, you need clarification or additional context, or you want to retrieve related documentation sections.