> For the complete documentation index, see [llms.txt](https://help.smartico.ai/welcome/llms.txt). Markdown versions of documentation pages are available by appending `.md` to page URLs; this page is available as [Markdown](https://help.smartico.ai/welcome/products/bi-and-reporting/benchmark.md).
# Benchmark
Benchmark Report – Monthly Trends & Industry Comparison
## 📘 Overview
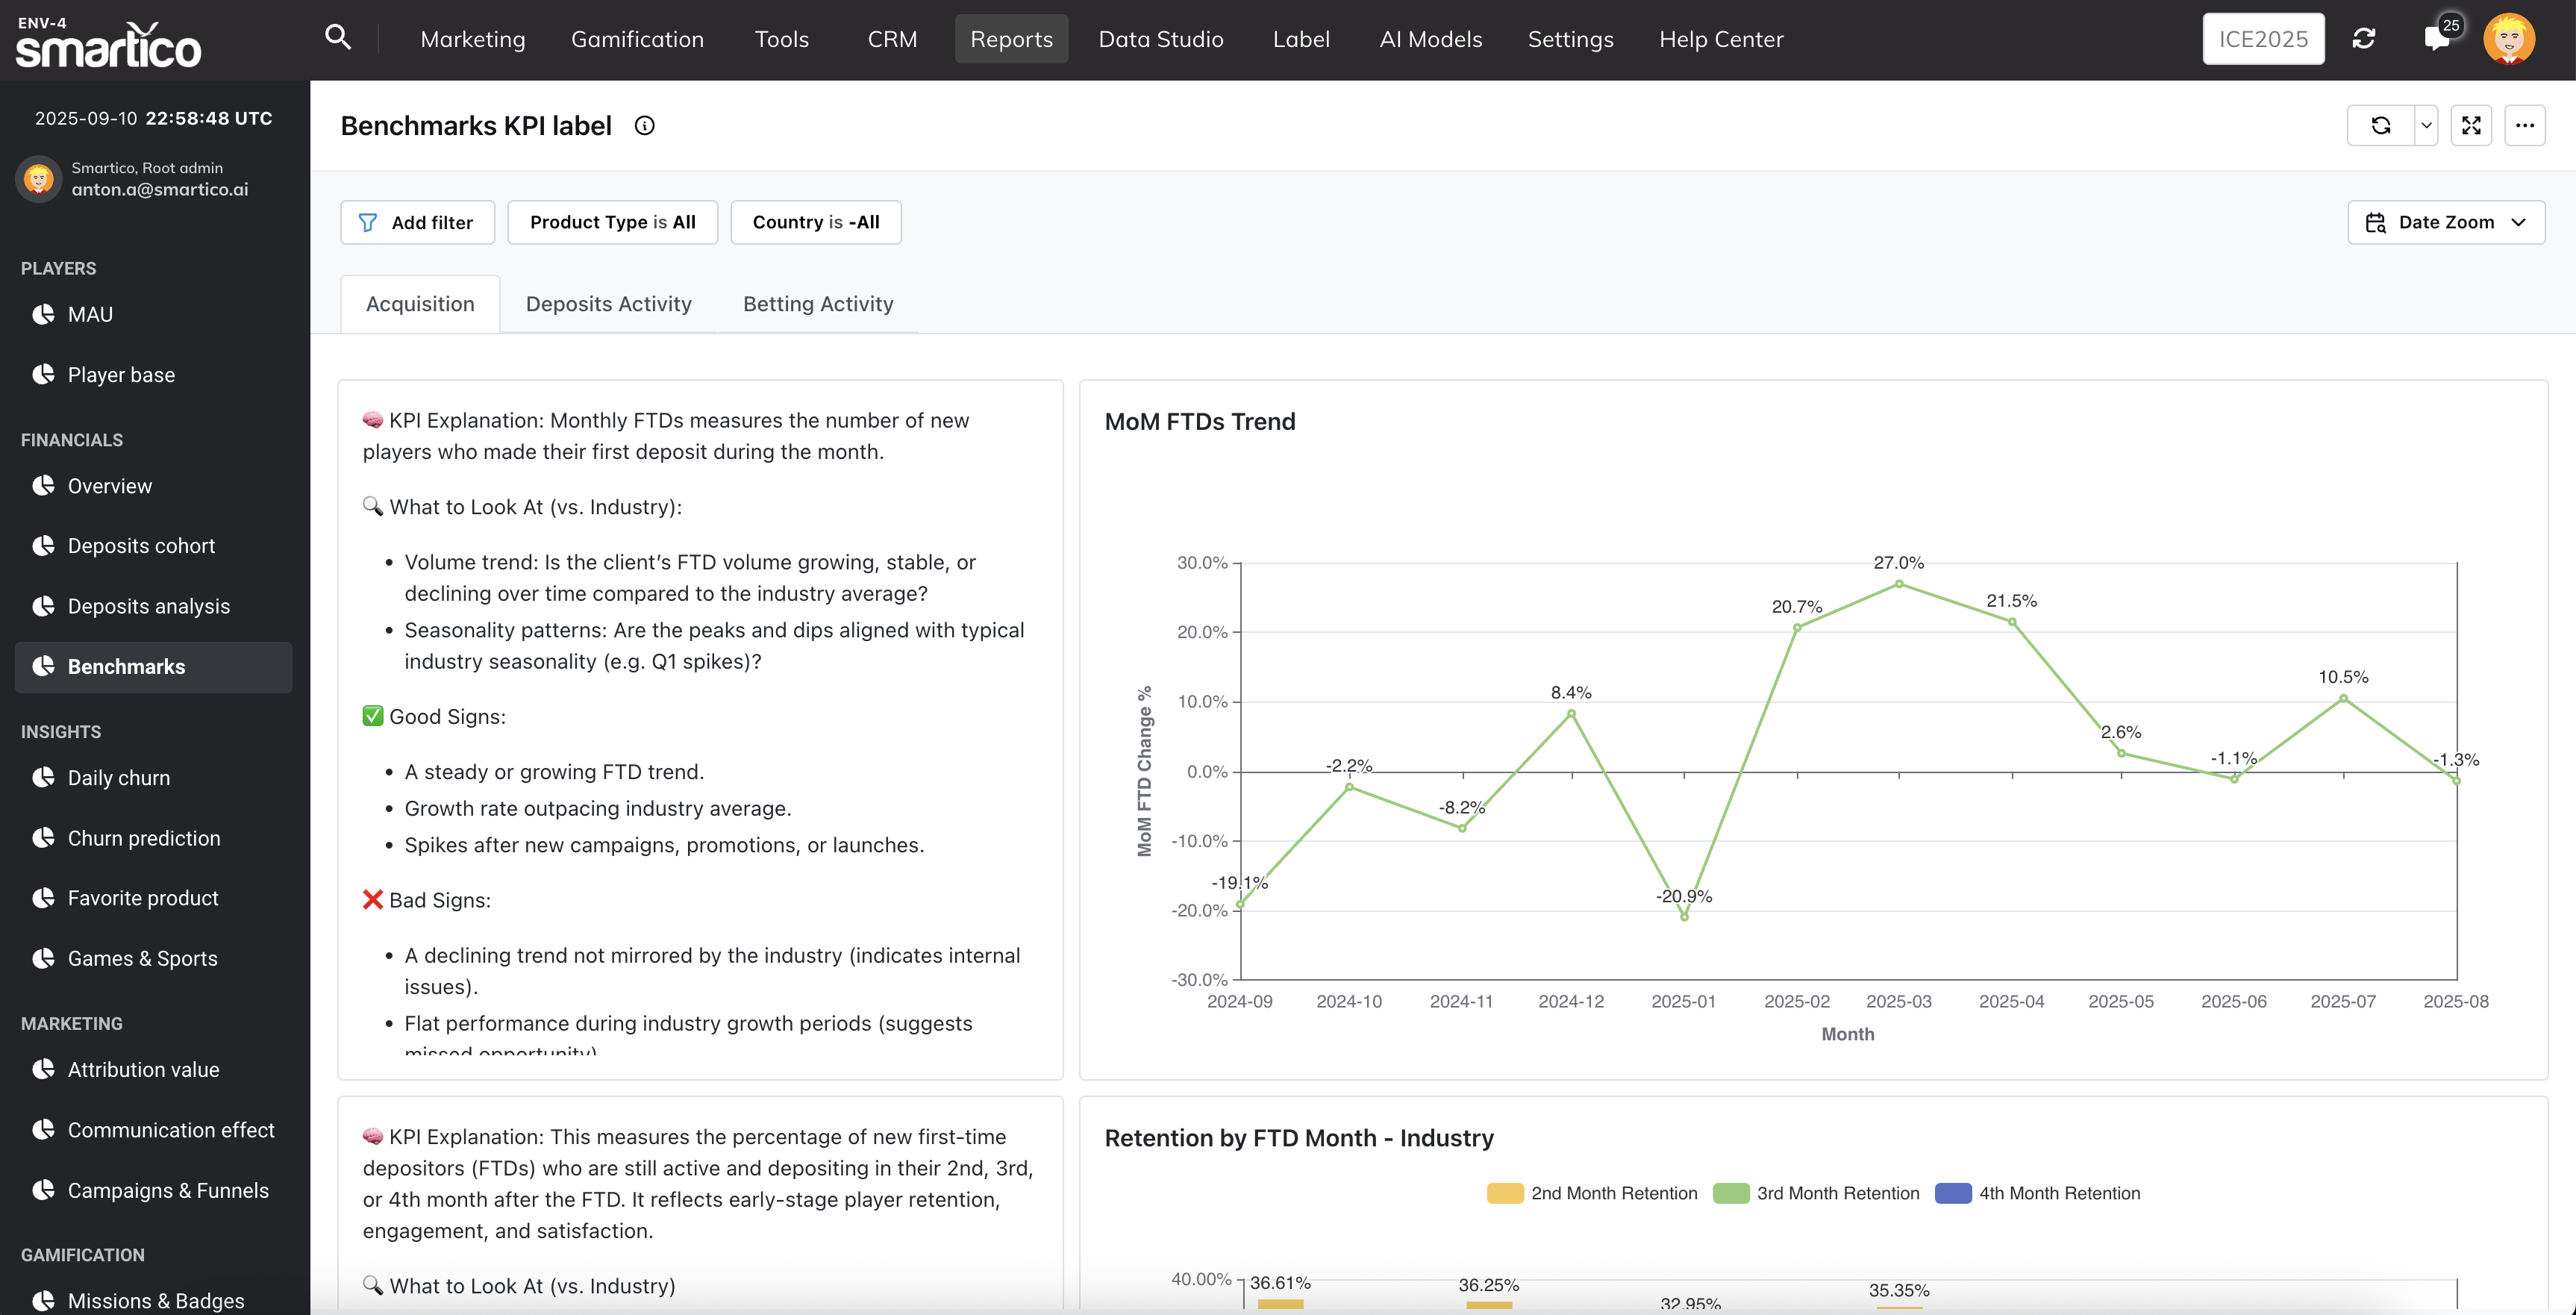
The **Benchmark Report** provides monthly trend analysis for your key KPIs, allowing you to compare your **brand’s performance against industry benchmarks**.\
This report is divided into three tabs:
* **Acquisition**
* **Deposit Activity**
* **Betting Activity**
It’s designed to help you monitor performance across the entire player lifecycle, identify trends, and make data-driven decisions.
#### 🔍 How to Access the Benchmark Report
1. Navigate to Reports → Benchmarks
2. Select:
1. Product (by player’s segmentation)
2. Country
3. Explore the tabs for detailed insights.
* **Currency:** All monetary metrics in this report are converted to and displayed in **EUR** using monthly exchange rates, ensuring standardized cross-brand industry comparisons. The report currency is fixed and cannot be changed to local currency.
## 📂 Acquisition Tab
Focus on new player acquisition and early-stage engagement.
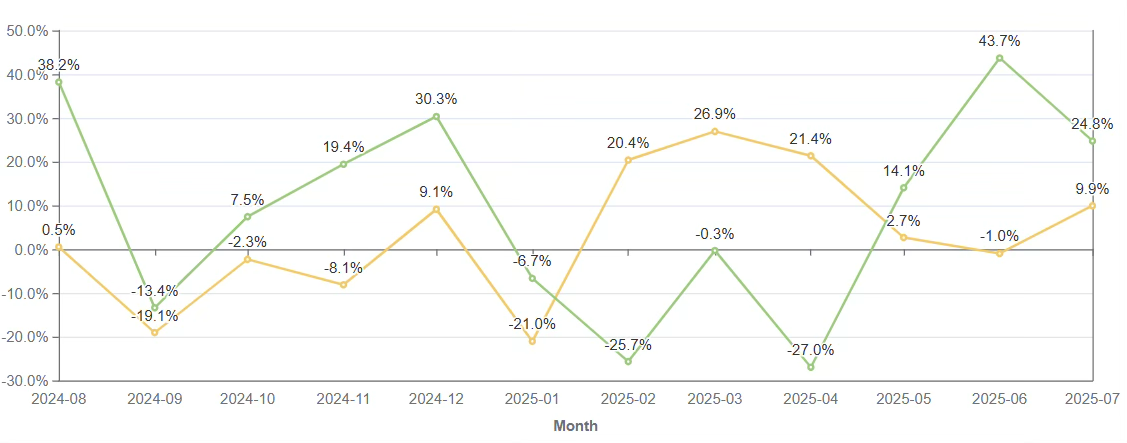
### :lightbulb: FTDs
**What it is**
The total number of unique players who made their first deposit within the selected period.
**Why it matters**
FTDs reflect the success of your acquisition efforts and are the starting point for your revenue funnel.
**Example Insight**
* If FTDs increased 20% MoM but retention didn’t improve, acquisition quality may be low (bonus hunters).
* If FTDs are flat but revenue is growing, you may be improving player LTV through engagement.
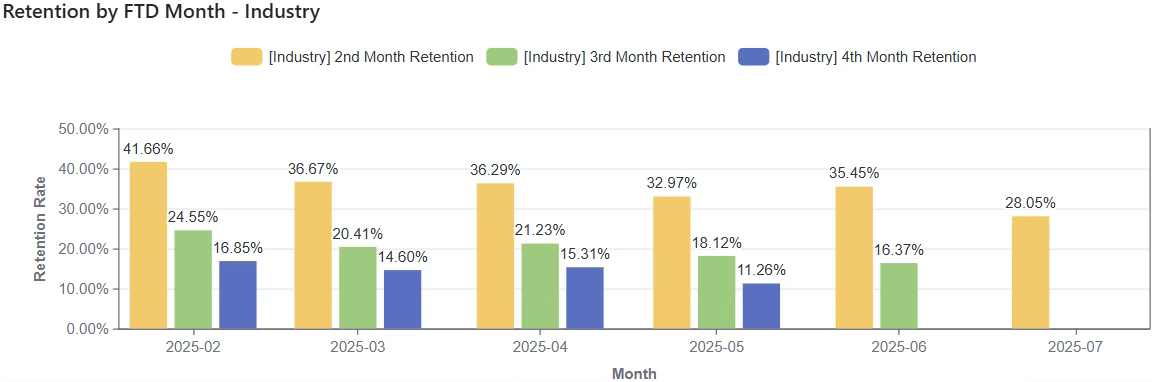
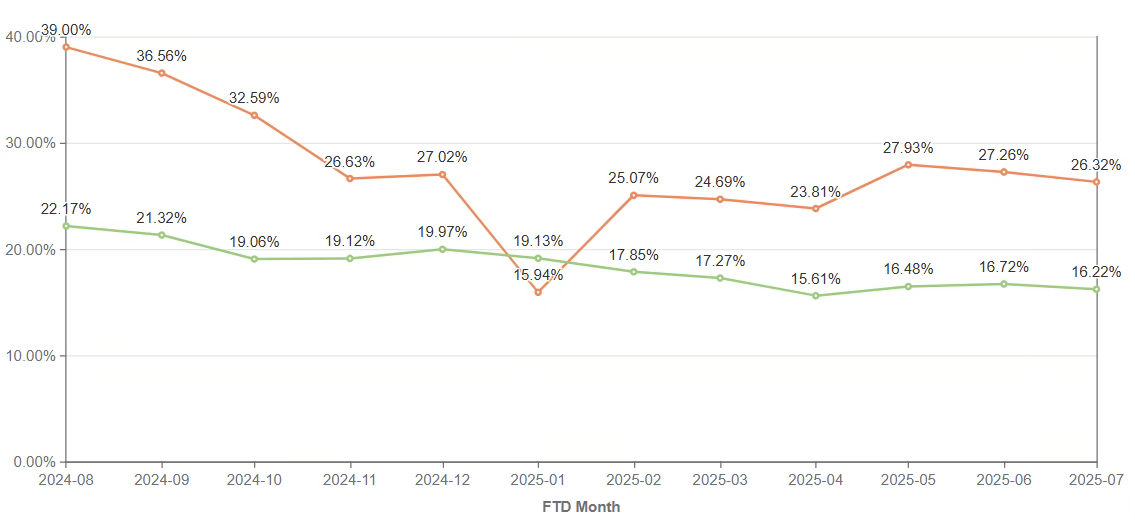
### :lightbulb: Retention by FTD Month
**What it is**
Percentage of players who deposited for the first time in a given month and remained active (or deposited again) in subsequent months.
**Why it matters**
Shows long-term engagement and product-stickiness of your acquisition cohorts.
**Example Insight**
* If Month 2 retention is 50% below industry benchmark, you may have onboarding or game experience issues.
* If early retention improves but later drops, focus on mid-lifecycle engagement.
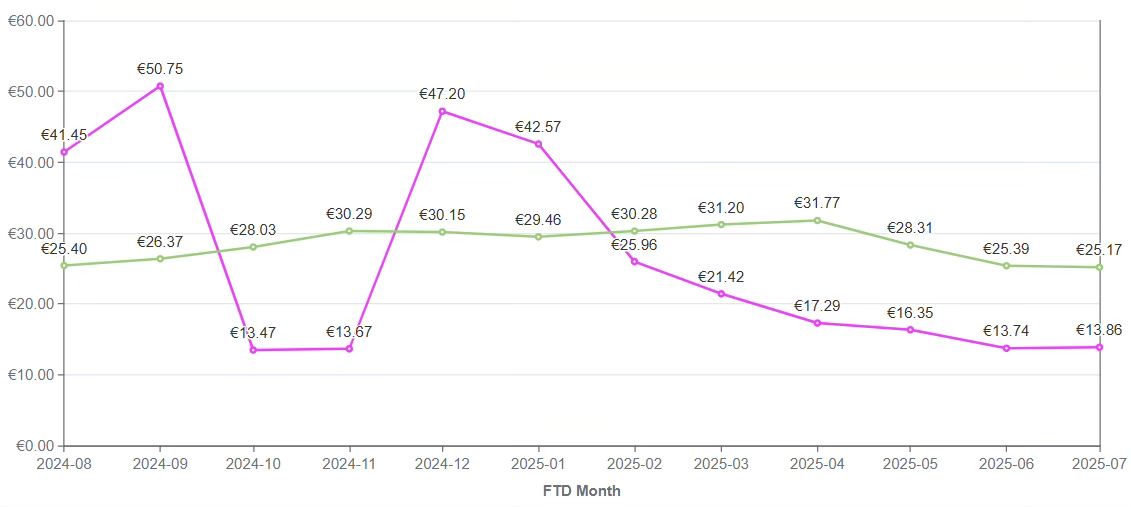
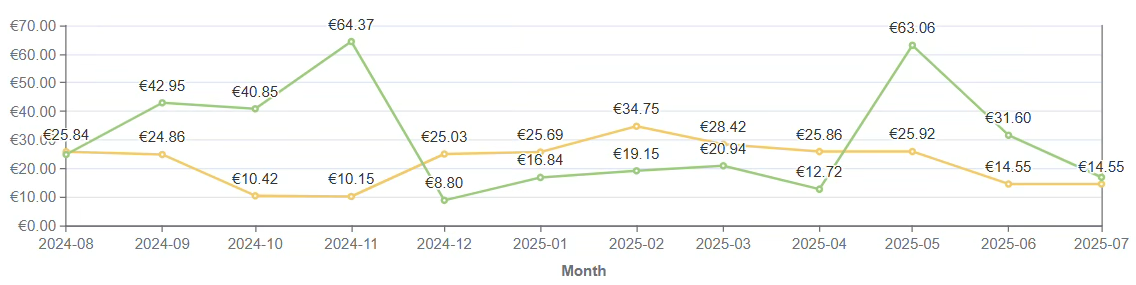
### :lightbulb: Average Deposit (7 & 30 Days from FTD)
**What it is**
The average deposit amount made after the initial first deposit per converted player, within the first 7 or 30 days of their FTD date. (The initial first deposit amount is excluded and tracked separately in Average FTD Amount per Player; the denominator is all FTD players in that cohort).
**Why it matters**
Helps identify short-term monetization potential and LTV forecast accuracy.
**Example Insight**
* If 7-day average rises while FTD count stays flat, you’re attracting higher-value players.
* If 30-day average drops while retention improves, players are depositing smaller amounts over time.
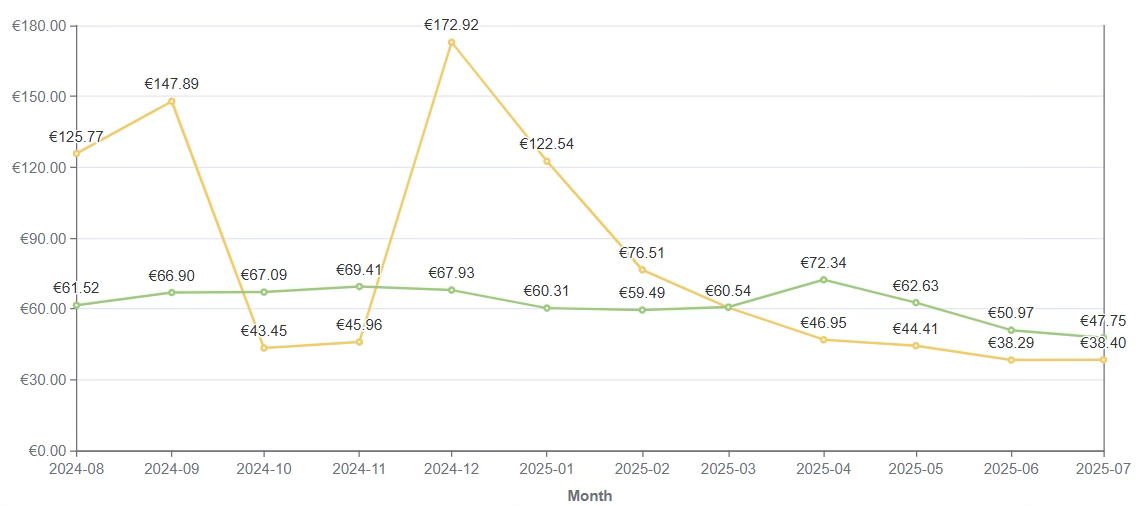
### :lightbulb: Average FTD Amount per Player
**What it is**
The mean value of the first deposit made by new players.
**Why it matters**
Indicates initial player confidence and market pricing expectations.
**Example Insight**
* If Avg FTD amount is below benchmark, consider adjusting welcome offers or deposit UI.
* If Avg FTD is high but retention is low, you might be attracting high-risk players who don’t stick around.
### :lightbulb: Registration-to-FTD Conversion Rate
**What it is**
Percentage of registered users who made their first deposit.
**Why it matters**
Measures the efficiency of your funnel from registration to deposit.
**Example Insight**
* If Conversion Rate drops after UI changes, your onboarding process needs review.
* If Conversion improves during promos, evaluate cost vs. lifetime value to ensure profitability.
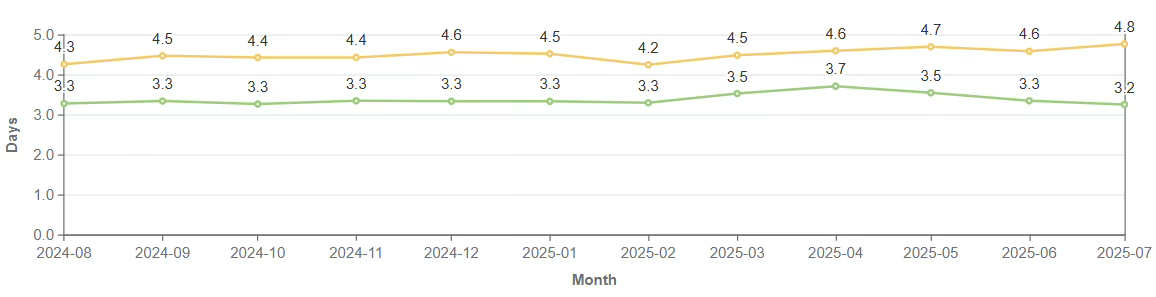
### :lightbulb: Days Between Registration and FTD
**What it is**
Average time between when a user registers and makes their first deposit.
**Why it matters**
A shorter gap usually signals a healthy funnel and strong intent.
**Example Insight**
* If this KPI increases, your onboarding flow might be too slow or bonuses unappealing.
* If it’s near zero but retention is poor, players may be pushed to deposit too early.
## 📂 Deposit Activity Tab
Helps analyzing the deposit patterns and player spending depth.
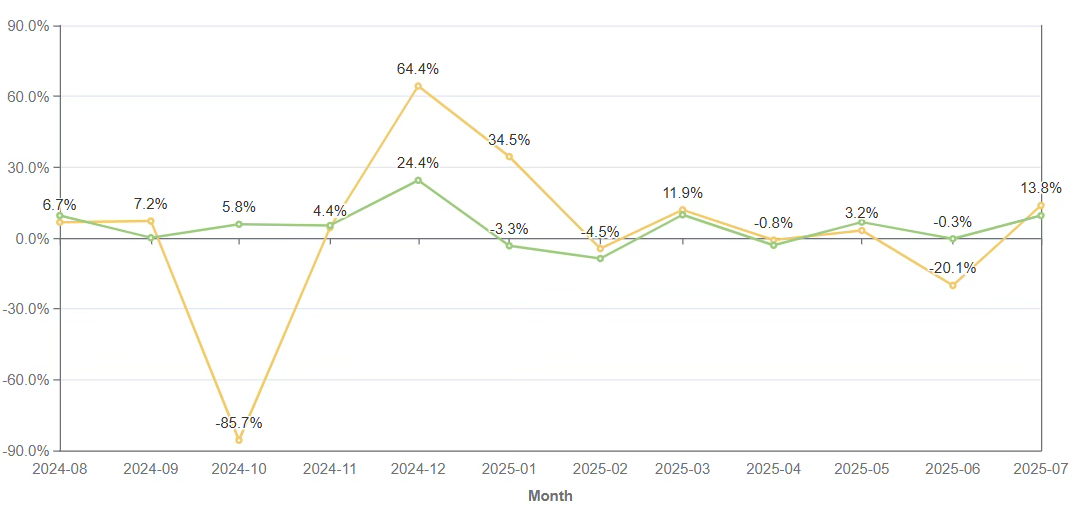
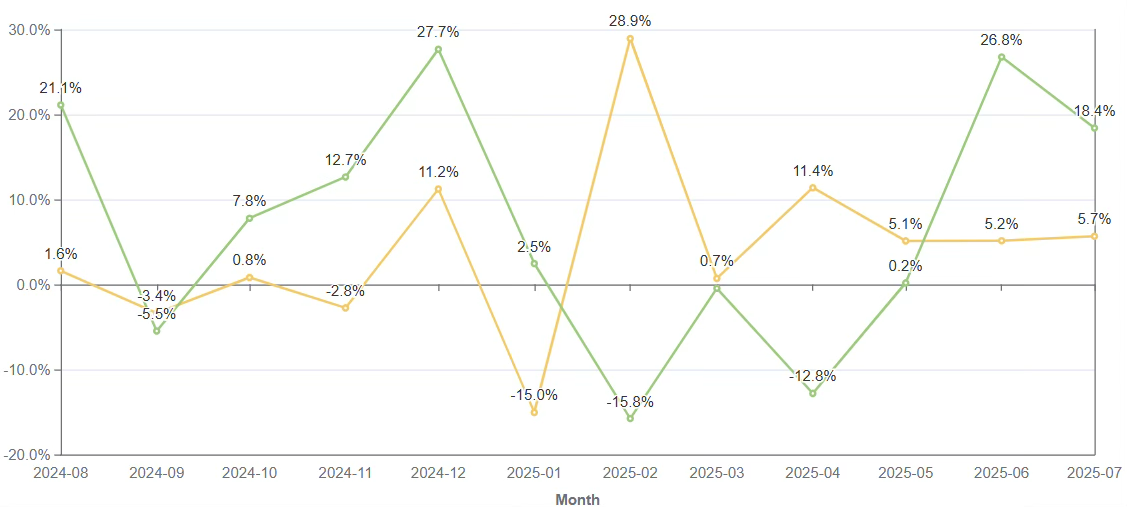
### :lightbulb: Deposit Amount MoM Change %
**What it is:**
The percentage change in total deposit amount compared to the previous month.
**Why it matters:**
Shows overall revenue momentum and seasonality.
**Example Insight:**
* If MoM deposit growth outpaces FTD growth, engagement from existing players is strong.
* If MoM deposits drop despite stable FTDs, retention or churn may be an issue.
Positive % = growth, Negative % = decline.
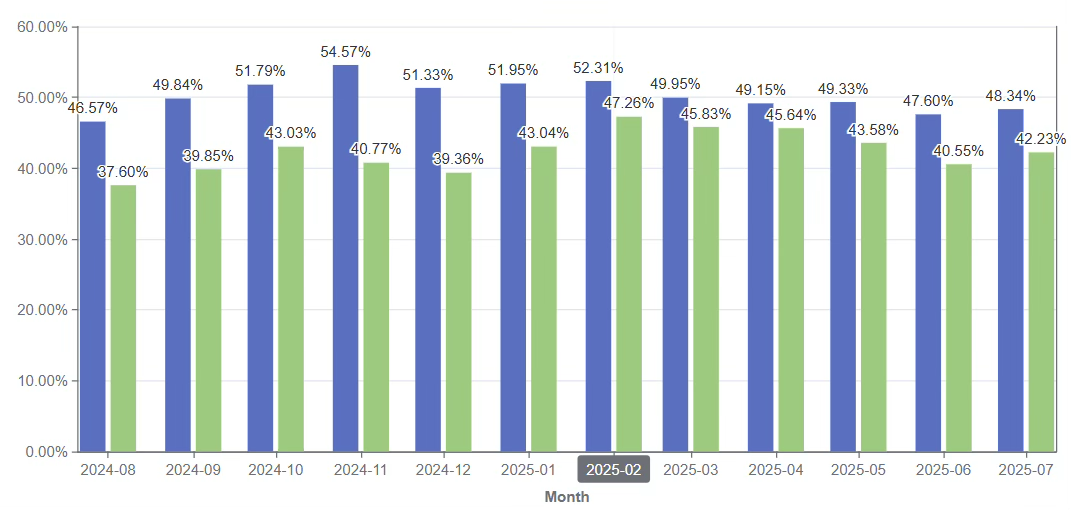
### :lightbulb: Net Cash to Deposit Ratio
**What it is:**
Deposit Amount minus Withdrawal Amount as a percentage of the Deposit Amount
**Why it matters:**
Indicates profitability.
**Example Insight:**
* If ratio drops, players might be winning more or bonuses are too generous.
* If ratio rises significantly, review game fairness and risk controls.
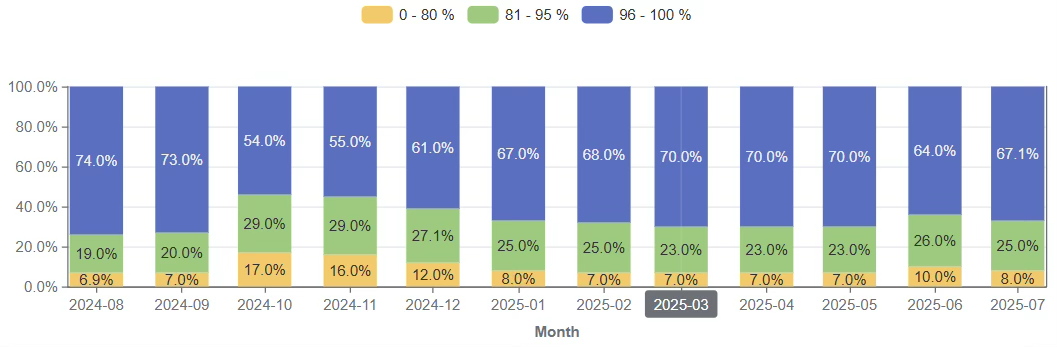
### :lightbulb: Deposit Amount Pareto
**What it is:**
Distribution of deposits by player segments (e.g., 20% of players contributing 80% of deposits).
**Why it matters:**
Shows dependency on high-value players (VIP concentration).
**Example Insight:**
* If Pareto ratio worsens (e.g., 10% of players = 90% of deposits), your revenue is too reliant on a few whales.
* If distribution becomes more balanced, you’re building a healthier player base.
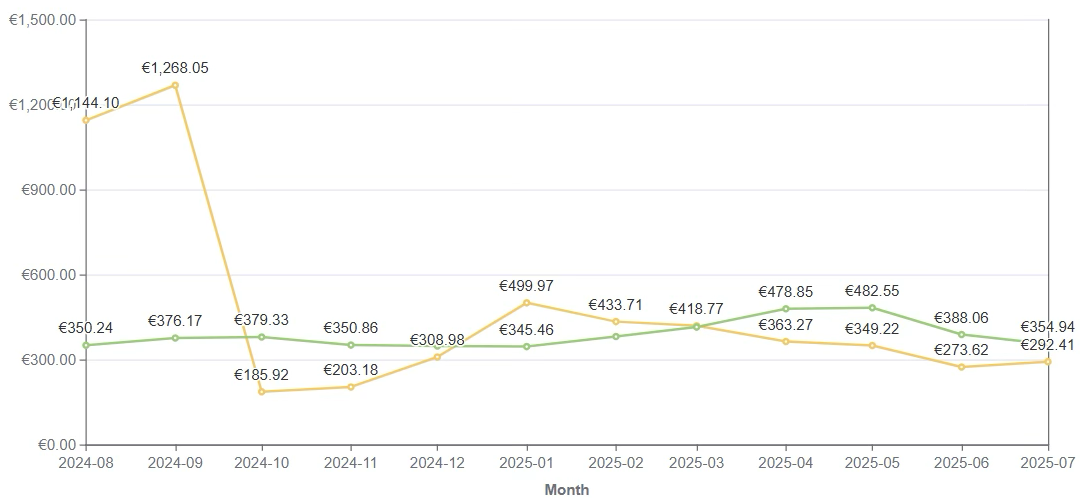
### :lightbulb: Average Deposit Amount per Depositor
**What it is:**
The average deposit amount per unique player who deposited during that specific calendar month (total monthly deposit amount divided by active depositing players). This is a monthly non-cumulative metric that resets each month.
**Example Insight:**
* If Avg Deposit per Depositor rises while depositor count drops, revenue is driven by VIPs, not mass.
* If it’s below benchmark, consider payment method optimization or tiered offers.
## 📂 Betting Activity Tab
Measure player engagement and activity for Casino and Sports.
### :lightbulb: Active Players MoM Change %
**What it is:**
Month-over-month percentage change in the number of players who placed at least one bet.
**Why it matters:**
Measures engagement growth or decline.
**Example Insight:**
* If Active Players drop but deposits stay stable, you have fewer but higher-value users.
* If both drop, your engagement strategy needs review.
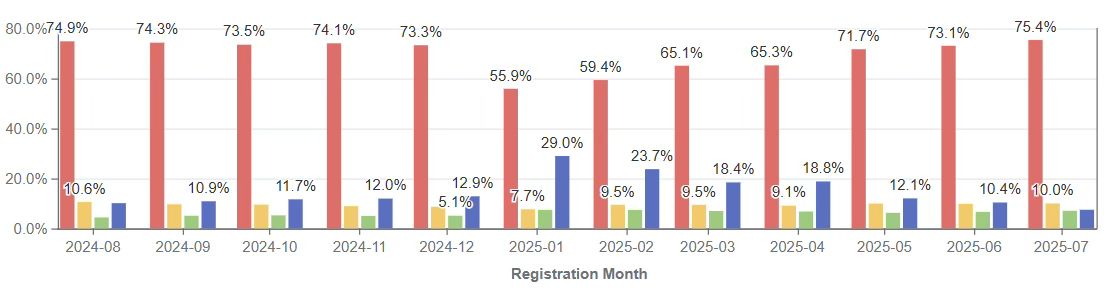
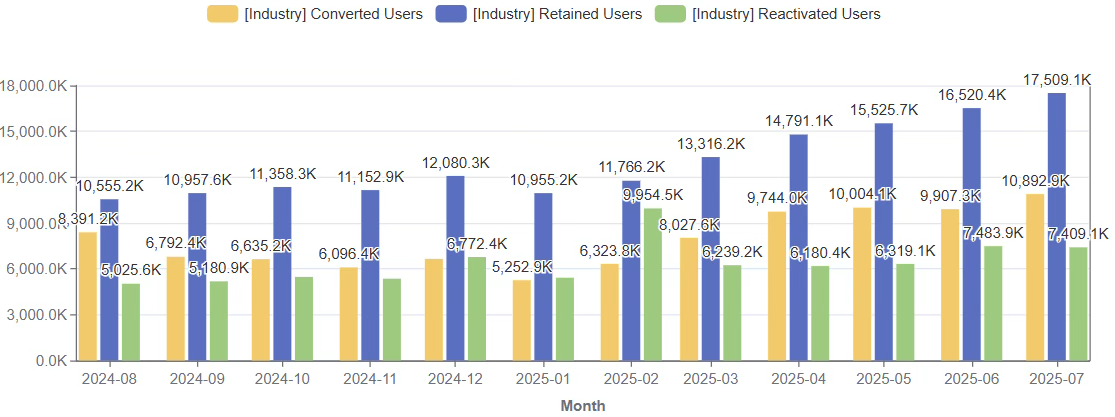
### :lightbulb: Active Players by Activity Segments
**What it is:**
Breakdown of active players into acquisition cohorts:
* New: First activity this month.
* Retained: Played last month and this month.
* Reactivated: Returned after inactivity.
**Example Insight:**
* If retained segment shrinks, churn is increasing.
* If reactivated grows, win-back campaigns are effective.
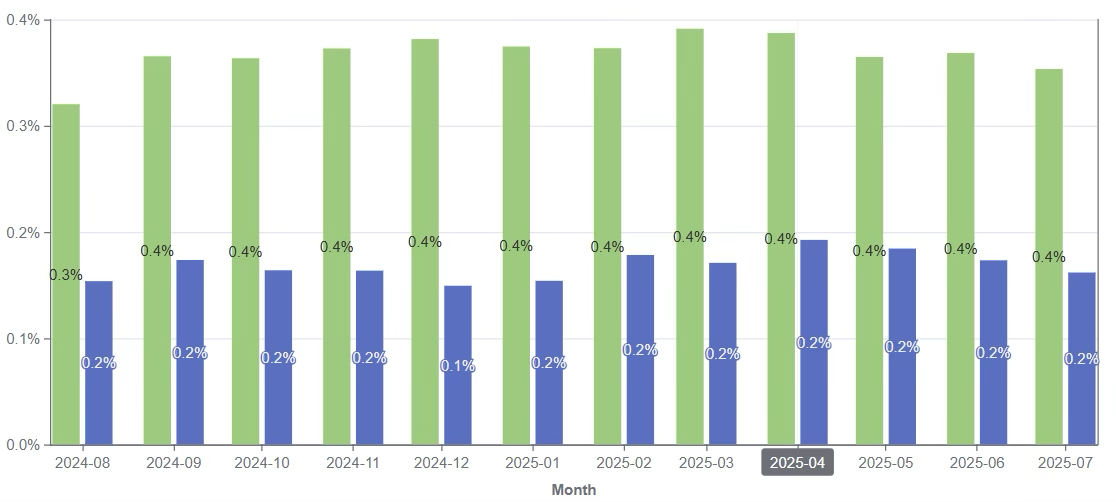
### :lightbulb: Stickiness
**What it is:**
Frequency of user activity within the month (e.g., ratio of DAU to MAU).
**Why it matters:**
Indicates how often players return and engage with your platform.
**Example Insight:**
* If stickiness drops but active users rise, you’re acquiring more low-frequency players.
* If stickiness improves, players are building habits.
### :lightbulb: Casino/Sport Average Playing Days
**What it is:**
Average number of distinct days a player has a bet in the period.
**Why it matters:**
Shows consistency of engagement in product vertical.
**Example Insight:**
* If Avg Playing Days rises, players are forming strong engagement loops.
* If it falls, review product variety and bonus structures.
### :lightbulb: Bet Amount per single Bet (Casino & Sports) – Median and 95th percentile
**What is median:**\
The median (50th percentile) of players' monthly average bet amounts during the selected period. This measures typical bet sizing per active player without distortion from extreme outliers.
**Why it matters:**
A stable median reflects consistent engagement from the core player base, rather than being skewed by a few high rollers.
**Example Insight:**
If Median Bet Amount increased by 15% MoM, while traffic stayed stable, it may indicate players are becoming more confident and engaged.
**What is 95th percentile:**
The 95th percentile of players' monthly average bet amounts—the minimum average monthly bet size among the top 5% highest-betting players. This reflects high-value player betting intensity.
**Why it matters:**
A strong top 5% indicates the presence and health of a high-value segment.
**Example Insight:**
If Top 5% Bet Amount dropped by 20% while Median remained stable, your VIP activity might be shrinking (possible churn or reduced high-stakes play).
If Top 5% surged during a promo period, check retention post-promo to confirm it’s not bonus-driven play.
✅ What to Look For
* How your KPIs compare to the industry benchmark.
* Which KPIs are trending up or down month over month.
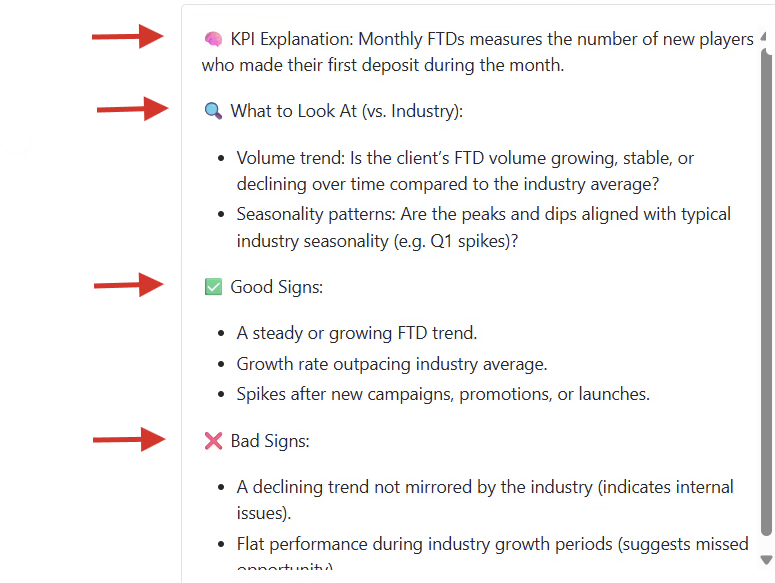
* KPI Explanation, What to Look At (vs. Industry), Good Signs, Bad Signs
### 📊 How Industry Benchmarks Are Calculated
The Industry Benchmark aggregates anonymized monthly performance data across operators on the platform:
* **Dynamic Market Comparison:** When you filter by **Country** or **Product**, the industry benchmark dynamically recalculates to show averages for that specific country and vertical, provided sufficient market volume exists (>1,000 active users and no single operator dominating the sample). If no country filter is selected, global platform averages are displayed.
* **Data Integrity:** Test accounts, QA environments, and presentation brands are excluded from benchmark calculations.
## ❓ Frequently Asked Questions
### Does "Average Deposit (7 & 30 Days from FTD)" include the first deposit amount?
No. This KPI measures the sum of deposits made after the first deposit transaction within the 7-day or 30-day window, divided by all new FTD players in that month's cohort. The initial first deposit is tracked separately in the **Average FTD Amount per Player** KPI.
### Can I change the report currency to my brand's local currency?
No. All monetary values across all tabs are normalized to EUR at monthly exchange rates so that your performance can be compared accurately against industry standards.
### Is "Average Deposit Amount per Depositor" a monthly or cumulative metric?
It is calculated per calendar month (total monthly deposit volume divided by unique depositors in that calendar month). It is not a lifetime cumulative figure and resets every month.
### How does benchmarking work for Sweepstakes casinos?
Sweepstakes brands use the dedicated **Benchmarks (sweeps)** report in the Back-Office. Benchmark averages in this report are calculated solely from other sweepstakes operators on the platform rather than real-money gaming casinos.
### Does the Industry Benchmark change when filtering by Country or Product?
Yes. When you filter by a specific Country or Product vertical, the benchmark comparison dynamically reflects the industry average for that specific market and product, as long as the country has sufficient player volume in the platform dataset.
---
# Agent Instructions
This documentation is published with GitBook. GitBook is the documentation platform designed so that both humans and AI agents can read, navigate, and reason over technical content effectively. Learn more at gitbook.com.
## Querying This Documentation
If you need additional information that is not directly available in this page, you can query the documentation by asking a question.
Perform an HTTP GET request on the following URL with the `ask` and `goal` query parameters:
```
GET https://help.smartico.ai/welcome/products/bi-and-reporting/benchmark.md?ask=&goal=
```
`ask` is the immediate question: it should be specific, self-contained, and written in natural language.
`goal` is what the user is ultimately trying to achieve, the reason they need the answer. Sharing it helps GitBook give you a better, more relevant answer. A goal is most helpful when it describes the outcome the user wants rather than restating the question. For example, with `ask=how do I create an API token`, a goal like `automate deployments from our CI pipeline` lets GitBook tailor the answer to that use case.
The response will contain a direct answer to the question and relevant excerpts and sources from the documentation.
Use this mechanism when the answer is not explicitly present in the current page, you need clarification or additional context, or you want to retrieve related documentation sections.